Content Editor, Dunham | 2025 ThinkAdvisor Luminaries Award Winner | 2026 Wealthies Finalist, Thought Leader of the Year | Macroeconomics, markets, geopolitics & global trends
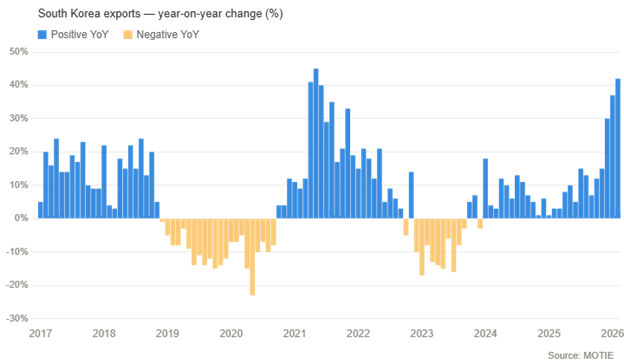
Why it matters: South Korea reports export data monthly - long before U.S. corporate earnings drop quarterly. And historically, when Korean exports accelerate, S&P 500 EPS tends to follow. When they soften, earnings growth decelerates. Right now, the signal is pointing sharply up.
The Deep Dive: Most investors obsess over U.S. jobs numbers, ISM surveys, and what the Fed says.
But almost none of them check Korean trade data.
That's a mistake. . .
South Korea is Asia's fourth-largest economy - and roughly half of it runs on exports.
So why does any of this matter beyond Korea's borders?
Because South Korea is the canary in the coal mine for global corporate earnings.
This is especially true in semiconductors - where Korea's chip and info-tech industry sits at the center of global technology supply chains (also autos and ships). Thus, when global demand changes noticeably, Korea feels it first.
The concept is simple.
Export data from Korea flows monthly, far before S&P 500 earnings drop.
The historical pattern is hard to ignore. When Korean exports accelerate, S&P 500 EPS tends to follow. And when they decline, earnings growth decelerates.
Of course, it's not a perfect signal (nothing in macro is). But it's one of the most consistent leading indicators that most investors have never looked at.
And right now, it's pointing sharply higher.
Thus, if history means anything, Q2 and Q3 earnings could come in well ahead of what many expect.
So keep an eye on South Korean exports.
Figure 1: TradingEconomics, Dunham April 2026
The U.S. Manufacturing Report Looked Good - But What's Inside Doesn't.
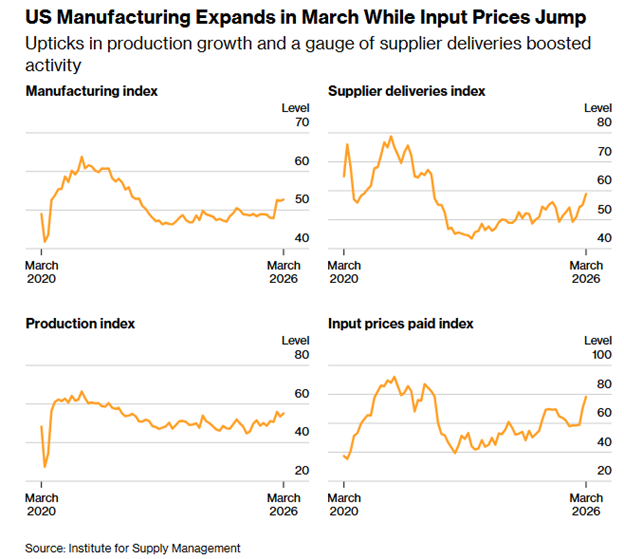
U.S. manufacturing expanded in March - but input costs surged at their fastest two-month pace in nearly a decade, a warning sign buried beneath a healthy headline number.
When manufacturers absorb a cost shock this fast, they don't hold it for long. What they pay today tends to show up in consumer prices tomorrow.
Why it matters: The ISM prices paid index is a monthly survey of what U.S. manufacturers are actually paying for raw materials and inputs - and it's one of the earliest signals of inflation building in the pipeline. At 78.3 and rising 19.3 points in two months, it's telling you a cost shock is already inside the system. Manufacturers rarely absorb it for long. What they pay today tends to show up in what consumers pay tomorrow.
Now the Deep Dive: The ISM manufacturing report dropped Tuesday. The headline read 52.7 - which marks expansion (anything over 50 = expanding; vice versa below 50).
Most people probably stopped reading there. But there’s more to it.
Because buried inside that report is one of the more alarming data points of the year.
The prices paid index – aka what manufacturers are actually paying for inputs - surged to 78.3 in March. This is a near 20-point jump in just two months - the fastest two-month climb in nearly a decade.
Thus, at 78.3, costs aren't just rising. They're running hot.
And the culprit isn't hard to find.
The Strait of Hormuz - through which roughly 20% of the world's traded oil flows - has effectively been closed since the war with Iran began.
But there’s more to it than oil. Hormuz is a key passage for aluminum, fertilizer, and helium - the last of which is critical for semiconductor manufacturing.
This is why the supply disruption is broader than the headlines suggest.
Meanwhile, 64% of manufacturing survey comments in March were negative.
40% cited the Middle East conflict directly. And only 20% cited tariffs - meaning the war is doing more visible damage to manufacturers right now than trade policy is.
That makes sense since tariffs can at least bring predictability, whereas war brings substantial volatility.
Making matters worse, new orders and backlogs grew at a slower pace. Employment is sinking. And supplier delivery times are stretching (the highest since May 2022).
Thus, it looks like the ISM expansion number is being propped up by supply disruptions - not growth.
When input costs rise this fast, manufacturers face two choices:
Eat it and watch margins shrink
Pass it through and push consumer prices higher.
History says they pass it through. And it’ll just take a quarter or two to show up.
The cost shock is already inside the system.
Consumer prices just haven't felt it yet.
So, beware a temporary lift in prices.
Figure 2: Bloomberg, April 2026
Financial Conditions Are Tightening Fast - and the Economy Will Feel It
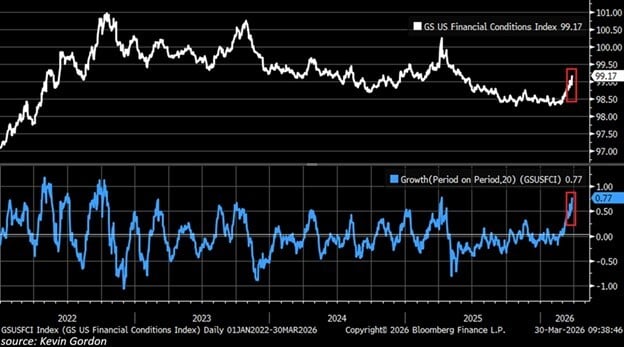
U.S. financial conditions are tightening at their fastest pace since Liberation Day — the April 2025 tariff shock that rattled markets.
When financial conditions tighten this quickly, the effects don't stay on Wall Street. They work their way into the real economy — slowing growth, squeezing borrowers, and cooling spending.
Why it matters: Financial conditions are essentially a real-time gauge of how easy or hard it is to borrow, spend, and invest across the economy. Rising Treasury yields, higher oil prices, a stronger dollar, widening credit spreads, and falling stock prices all tighten conditions simultaneously - squeezing households and businesses even without a single Fed rate hike. When conditions tighten this fast, economic activity tends to slow in the months that follow.
Now the Deep Dive: Most people think the Fed controls financial conditions.
It doesn't – well, not entirely. Markets do.
And right now, markets are doing the Fed's job for it.
The Goldman Sachs U.S. Financial Conditions Index - which tracks the combined effect of interest rates, credit spreads, equity prices, and the dollar on the broader economy - just hit 99.17.
That's the tightest reading since June 2025. More worrying is the speed at which it tightened - a 0.77-point surge in just 20 days, the second-fastest tightening pace since the Fed's aggressive 2022 rate hiking cycle.
Put simply, financial conditions are squeezing the economy nearly as fast as they did when the Fed was back hiking rates at the most aggressive pace in over four decades (1970-80s).
They didn’t even need to hike rates.
So what's driving it?
The same culprit as topic two above. The war in Iran has sent oil prices surging, pushed Treasury yields higher as markets price in renewed inflation, strengthened the dollar, and widened credit spreads as risk appetite fades.
Every one of those moves by itself tightens conditions. But together, they hit like a single coordinated shock.
Keep in mind that tighter financial conditions ripple across the economy from all sides.
Mortgage rates climb.
Auto loans get more expensive.
Small business credit tightens.
Companies facing higher borrowing costs pull back on hiring and investment.
Consumers carrying variable loans - like credit cards, adjustable mortgages, HELOCs - feel it in their monthly payments.
The private sector doesn't need a recession announcement to start behaving like one is around the corner. Rising energy costs and more expensive debt could be enough to tip things.
And when financial conditions are tightening this fast - squeezing credit, raising borrowing costs, and cooling risk appetite all at once - the fallout can be bad.
The Middle East didn't just disrupt oil supply. It may have disrupted the Fed’s agenda for the next year.
Time will tell.
Figure 3: Seeking Alpha, April 2026
Anyway, who knows how this will all play out?
This is just some food for thought as we watch how these trends develop.
We’ll be keeping a close eye on things. Enjoy the rest of your weekend.
This communication is general in nature and provided for educational and informational purposes only. It should not be considered or relied upon as legal, tax or investment advice or an investment recommendation, or as a substitute for legal or tax counsel. Any investment products or services named herein are for illustrative purposes only and should not be considered an offer to buy or sell, or an investment recommendation for, any specific security, strategy or investment product or service. Always consult a qualified professional or your own independent financial professional for personalized advice or investment recommendations tailored to your specific goals, individual situation, and risk tolerance. All examples are hypothetical and are for illustrative purposes only.
Information contained in the materials included is believed to be from reliable sources, but no representations or guarantees are made as to the accuracy or completeness of information. This document is provided for information purposes only and should not be considered as investment advice.
Dunham & Associates Investment Counsel, Inc. is a Registered Investment Adviser and Broker/Dealer. Member FINRA/SIPC. Advisory services and securities offered through Dunham & Associates Investment Counsel, Inc.
South Korean Export Boom, ISM's Hidden Cost Shock, & Tightening Financial Conditions | Dunham