Content Editor, Dunham | 2025 ThinkAdvisor Luminaries Award Winner | 2026 Wealthies Finalist, Thought Leader of the Year | Macroeconomics, markets, geopolitics & global trends
Listen to this blog here
15:31
Key Takeaways:
Do oil price spikes cause recessions: Almost all oil spikes above 50% since 1970 have been followed by a recession — and Brent is already up 75% in 2026, blowing past that threshold in under four months.
Why 2026 isn't 1973: Energy costs are just 1.9% of household spending today vs. 6%+ during the 1980 shock — and the U.S. now produces a record 14 million barrels per day. The same spike hits with far less force.
The consumer was already breaking before oil surged: Record $18.8 trillion in household debt, 1 in 8 credit card holders seriously delinquent, and 25% of student loan borrowers behind. An oil shock is hitting a consumer with nothing left to absorb it.
Stagflation risk 2026: GDP at 0.7%, PCE inflation at 2.8%, and a 75% energy spike incoming. The Fed can't cut without stoking inflation. Can't hike without triggering recession. It's paralyzed.
Three wildcards that could make it worse: Record margin debt that could trigger forced selling, a permanently higher oil price floor even after Hormuz reopens, and global contagion recycling back into U.S. markets through Gulf and Asian capital flows.
By now, you've seen the headlines.
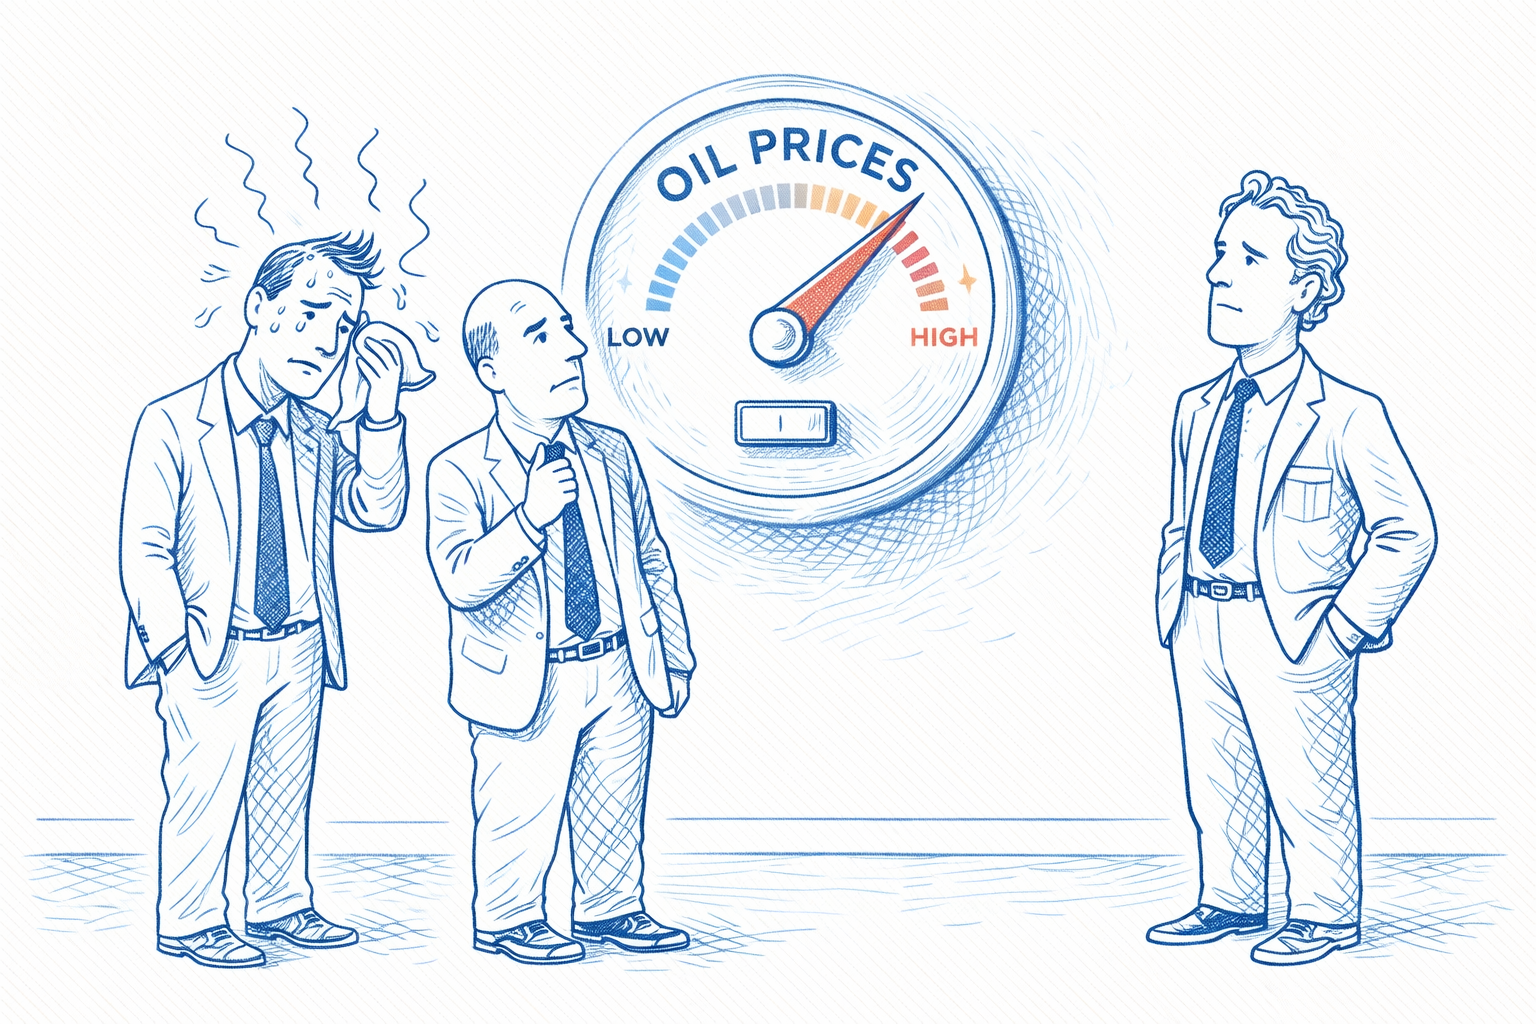
Chaos in the Middle East. Brent crude is around $110. Gas prices are spiking. A jaded consumer base. And the word "stagflation" was plastered across every financial media outlet from here to Tokyo.
The question on everyone's mind: Is an oil-fueled recession coming in 2026?
Maybe. Maybe not. There’s certainly a case for both arguments right now.
So, let’s break down the good, the bad, the ugly, and some wildcards of surging oil prices.
Do Oil Price Spikes Cause Recessions? The Historical Evidence
Looking back at history, there’s a pattern that’s hard to ignore.
Every significant oil price spike in modern history - above 50% - was followed by a recession.
1973. 1979. 1990. 2001. 2008.
To highlight this - look at real (inflation-adjusted) oil prices plotted against every U.S. recession since 1970. Each time oil spiked more than 50% above its long-run average, a recession hit.
Now, does this mean oil caused the recession? Or were higher oil prices and a recession both symptoms of some other variable? It’s hard to say
But we can note the cause-and-effect here - aka higher energy costs drain household income.
If consumers spend more at the pump = less on everything else. Spending contracts. The economy follows.
So yes. The alarm bells make sense. Especially since brent crude started 2026 around $60 per barrel. And now, it's trading around $110, which puts the YTD spike at roughly 75%.
Thus, it’s already blown past the 50% threshold in less than four months.
Meaning – a recession could be around the corner if history means anything.
But before we call it a day, there’s a big hiccup in that argumentthis time around.
The Not So Bad — Why 2026 Isn't 1973
The 1970s oil shock comparisons flooding the financial media right now miss something critical.
And that is the U.S. economy being far less dependent on oil than it used to be.
Think about it - more fuel-efficient cars, more remote work, more people working from home, a more service-oriented economy, etc. Energy just doesn't eat up household budgets the way it once did.
Put simply, the same price spike that crippled consumers in 1973 hits with a lot less force this time around.
Then there's the production (supply) picture - which doesn't get enough attention.
The U.S. pumped a record ~14 million barrels per day in 20252. That's more than 35% above the previous peak reached back in the 1970s. And unlike the 1970s - when the U.S. was heavily dependent on foreign oil - America became a net energy exporter in 2019, a position it has held ever since (aka production exceeds consumption this time around).
Figure 3: EIA, Dunham, March 2026
One caveat worth mentioning. The U.S. is still a net importer of crude oil, specifically about 2.2 million barrels per day.
Why? It comes down to refinery design. See, most U.S. refineries were built decades ago to process heavy, sour crude - the thick stuff that comes from the Middle East and Venezuela.
But the shale boom gave us light, sweet crude (aka WTI - Western Texas Intermediate) - a completely different grade of oil. And ironically, our refineries can't efficiently process our own light crude scale.
So we export our light shale oil abroad and import the heavy crude our refineries actually need.
The mismatch is a double-edged sword. And it means Americans still feel global oil price moves at the pump - regardless of how much we produce domestically.
But here's the other side of that coin. . .
If you're a U.S. oil producer - or you own energy stocks - higher prices mean fatter margins.
Shale producers, refiners, LNG exporters are all booming right now. Thus, the same shock hitting your gas bill may actually be working in your portfolio's favor (if you own these energy stocks).
It likely won’t fully offset the pain at the pump for many Americans. But it's a reminder that in markets, every crisis does have a winner.
The point is - the shock-absorption capacity today is far higher than in any prior cycle. And beware the 1973 comparisons. It’s certainly not the full picture.
The Bad — The Consumer Was Already Drowning Before Oil Exploded
So, even if the U.S. economy handles higher oil prices better than before – it may be too late.
Why? Because the consumers didn't enter this price surge from a position of strength.
Remember, in 2017, delinquencies were decelerating - aka the trend was improving post-2010. Today it’s accelerating. Same number, yet completely different trajectory. That distinction matters more than the headline figure.
The New York Fed put it plainly: "You see evidence consistent with a K-shaped economy. Some groups are really struggling."
Now layer in a 75%+ energy shock on top of all that.
For the bottom half of the income distribution - already carrying record balances at an average credit card rate of roughly 21% (a toxic combo) - a higher monthly gas bill may mean the difference between filling the tank or paying a minimum debt payment.
The point is, an oil shock is hitting an already fragile consumer. And there may simply be nothing left to absorb it - without serious cuts to spending or a wave of defaults.
The Ugly: The Fed is Staring Down The Stagflation Barrel
Making things worse - the one institution that could normally help is essentially paralyzed.
Meanwhile, PCE inflation - the Fed's preferred measure - sits at 2.8% (far above the 2% target). And that's before the full pass-through of a 75%+ energy spike hitting gas tanks, electric bills, grocery shelves, airline fares, manufacturing costs, etc.
So, with prices surging, the Fed can't cut - because cutting rates while inflation is reaccelerating - driven by an energy shock - is like pouring gasoline on a fire. It risks blowing up whatever credibility remains around the 2% goal.
But it can't hike either – since hiking into a 0.7% GDP print with consumer delinquencies at a near-decade high, private credit woes, and an anemic job market is how you manufacture the recession you're trying to avoid.
Thus, it sits. Watches. Waits. And prays.
Because this is becoming a classic stagflation trap – aka when growth slows while inflation rises. It’s the one scenario the Fed was never designed to solve (central bank toolkits were built for a world where inflation and growth move in opposite directions). When both go wrong at once, they’re stuck with serious trade-offs (make inflation worse or make a recession worse).
Jerome Powell's term ends in May. Whoever inherits that chair (looking like Kevin Warsh) walks into one of the most difficult macro environments since Paul Volcker in the 1980s.
I know I wouldn’t want that job.
3 Wildcards That Could Make the 2026 Oil Shock Much Worse
So far, the bad and ugly seem to outweigh the good.
But there are a few wildcards sitting on the table - known unknowns that could take a difficult situation and make it genuinely dangerous.
But if the Middle East chaos spreads and oil stays high (or goes higher), volatility can surge, corporate earnings drop, and investor sentiment sour – all pushing prices lower quickly.
Falling prices could trigger margin calls – aka when investors are forced to dump assets to raise cash to cover their debts.
Every additional week of closure narrows the window for prices to swing back lower.
Bypass routes – like pipelines through Saudi Arabia and Oman's ports - handle less than half of normal Hormuz flows. And the longer this drags on, the more structural the price impact becomes.
But keep in mind - even if a ceasefire is reached, the infrastructure damage, war-risk shipping insurance (the big issue right now), and rerouting costs mean the floor could be permanently higher.
This kind of risk will always linger in the back of everyone’s mind – and firms will price that in.
Getting back to ~$70 oil at this point seems unlikely - at least for a very long time.
3. Global contagion.
Even though the U.S. has more shock-absorption than most – it can still boomerang back as the rest of the world gets crushed. Especially in U.S. markets.
Thus, no oil money flowing = less demand for U.S. markets = potentially higher yields and weaker returns.
Meanwhile, Asia sources much of its crude from the Middle East. And higher prices eat away at their trade surpluses - surpluses that also get recycled back into U.S. markets. Similarly, less surplus = less buying of U.S. assets. Same problem, just different geography.
And Europe isn't much better. Natural gas just exploded 63% in a single week after Iranian drones crippled Gulf oil facilities - marking the largest weekly jump since Russia invaded Ukraine.
Once you factor all this in, the U.S.'s 1.9% PCE energy share starts to look almost comfortable by comparison (almost).
But that's cold comfort since a global growth slowdown would hit U.S. multinationals through the export channel - even if domestic demand holds up better than feared.
The point is that the rest of the world getting bitten harder isn't a reason to relax. Because it'll swing right back into our face from one angle or another.
So, Where Does This Leave Us?
Like all things in macro, geopolitics, and markets - there are more variables than anyone can fully grasp. Things we can gauge. Things we can't. And things nobody sees coming until they're already here.
So, the best we can do is keep both eyes open - process what we know, account for what we don't, and make an educated bet on what comes next.
The not-so-bad is real. The U.S. absorbs oil shocks better than it ever has. Energy producers are benefiting. The 1973 comparison may be overdone.
But the bad and ugly should get more attention
A consumer already drowning. A Fed with no good moves. And an economy walking into a stagflation trap.
And the wildcards? Margin debt. A potentially higher oil floor. Global contagion swinging back through U.S. markets. Any one of those alone is manageable. But all three together is a different beast.
Before I end this, there’s one thing worth remembering: high oil prices are ultimately their own cure. As I covered in my piece on the capital cycle, high prices attract supply. Production ramps up (producers expand to capture higher profits). Demand falls (people consume less). Thus, what was once a shortage can become a glut (and vice versa).
Markets self-correct. Historically, they always do - eventually.
The question now is how much damage gets done in the meantime? Who knows.
This communication is general in nature and provided for educational and informational purposes only. It should not be considered or relied upon as legal, tax or investment advice or an investment recommendation, or as a substitute for legal or tax counsel. Any investment products or services named herein are for illustrative purposes only and should not be considered an offer to buy or sell, or an investment recommendation for, any specific security, strategy or investment product or service. Always consult a qualified professional or your own independent financial professional for personalized advice or investment recommendations tailored to your specific goals, individual situation, and risk tolerance. All examples are hypothetical and are for illustrative purposes only.
Information contained in the materials included is believed to be from reliable sources, but no representations or guarantees are made as to the accuracy or completeness of information. This document is provided for information purposes only and should not be considered as investment advice.
Dunham & Associates Investment Counsel, Inc. is a Registered Investment Adviser and Broker/Dealer. Member FINRA/SIPC. Advisory services and securities offered through Dunham & Associates Investment Counsel, Inc.