Content Editor, Dunham | 2025 ThinkAdvisor Luminaries Award Winner | 2026 Wealthies Finalist, Thought Leader of the Year | Macroeconomics, markets, geopolitics & global trends
Here Comes The Liquidity: The Fed’s Balance Sheet Is Growing Again - and Markets Are Noticing
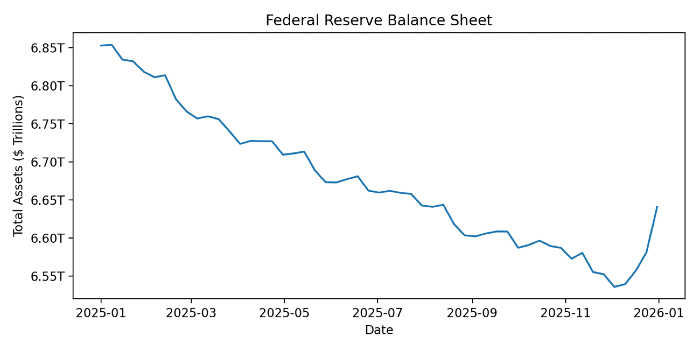
The Fed has reversed course, expanding its balance sheet by roughly $105 billion since early December - the largest increase since the 2023 regional banking crisis.
More liquidity is back in play, a change that historically has coincided with easier financial conditions, higher risk-taking, and pockets of excess across asset markets.
What you need to know: The Fed’s balance sheet has expanded by roughly $105 billion since early December, its largest jump since the 2023 regional banking crisis, a clear sign that liquidity is easing again.
Why it matters: For the first time in nearly three years, the Fed is expanding its balance sheet as bank reserves have grown tight. This marks a notable shift in liquidity conditions, putting more money back into the system - a backdrop that historically has fueled higher risk-taking and pockets of bubbly behavior across asset markets.
This is the cycle we all know. When inflation runs hot or the economy overheats, the Fed drains liquidity. And when stress shows up and things cool too fast, liquidity comes back.
COVID was the economic overreaction of a lifetime. Policy makers stimulated as if there were no tomorrow. Unsurprisingly, inflation followed - delivering the worst bout since the 1970s. And the Fed later responded by slamming the brakes.
That helped bring inflation down. But it also drained parts of the banking system dry.
Thus, as reserves thinned out, stress started leaking through the plumbing. And now, to fix the next problem created by the last fix, the Fed is easing again.
It’s like whack-a-mole. You hit one mole and two more pop up.
Since bottoming in early December, the balance sheet has logged its first meaningful month-over-month increase - over $100 billion - since the Silicon Valley Bank collapse in early 2023. On top of that, the Fed will be buying roughly $40 billion in Treasury bills per month (started December 12th), keeping liquidity flowing.
So, are the banking risks fully resolved now? Who knows. Is this the beginning of a new liquidity trend? Time will tell.
But one thing is clear - added liquidity has a habit of finding its way into asset prices (we’re already seeing some of that lately as markets rally).
Said another way, the Fed’s eased off the brakes. And started pressing the gas again.
Buckle up.
Figure 1: St. Louis Federal Reserve, Dunham, January 2026
High Interest Rates Were Supposed to Break the Economy - Here’s What Actually Changed
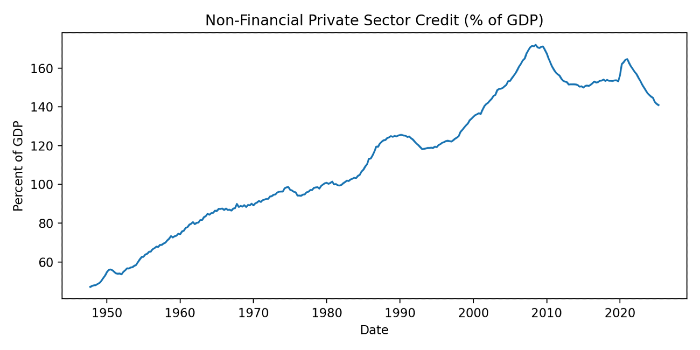
High interest rates haven’t broken the economy because the private sector has steadily deleveraged, leaving households and businesses far less fragile than in past cycles.
The stress didn’t disappear - it only changed hands, with governments absorbing leverage through deficits while financial pressure builds in pockets of the private economy.
What you need to know: The U.S. private sector has been deleveraging (paying down debt) for years, leaving households and businesses less indebted – at least as a percentage of GDP - than many assume.
Why it matters: A less-leveraged private sector can absorb higher interest rates far better, which helps explain why the economy has remained resilient even as borrowing costs surged since 2022 and government deficits ramped up.
Now the Deep Dive: We’ve all heard it before.
“High interest rates are supposed to break something.”
And historically, that’s how it would work. Higher debt service costs squeeze cash flows, slow spending, and eventually force deleveraging.
But remember - that logic only works if the private sector is overextended.
That’s where this cycle gets interesting.
Since the 2008–09 financial crisis, U.S. households and non-financial businesses have repaired their balance sheets. Thus, private-sector debt has fallen as a share of GDP.
Thus, on a net basis, the private sector has been deleveraging relative to the size of the economy.
“But wait - debt keeps rising.”
That’s true. It’s just coming from the other bucket - the federal government.
See, private-sector deleveraging is deflationary by nature - less credit means less demand. And it also means future spending must be curbed to repay old debt.
To offset that drag post-2008, governments stepped in - running ever-larger deficits and essentially absorbing leverage on behalf of the economy.
One bucket drained while the other filled - rapidly.
That helps explain the paradox of recent years - where policy tightened, rates jumped, and yet the economy didn’t implode.
“So why does government debt matter less here than private debt?”
They both matter in their own ways. But in this context, it’s because governments can issue debt in a currency they control – whereas households and businesses can’t.
As we all know, when the private sector loses income, the pain is immediate. We can’t keep spending if we’re tapped out and income isn’t growing.
Governments, by contrast, can roll debt, tax, or - in serious cases - print money to meet obligations (with inflation as the tradeoff).
Thus, on average, the private sector today appears less fragile than it was in prior cycles.
But keep in mind, averages can mislead. . .
GDP is an aggregate measure. Thus, in an economy marked by widening inequality, aggregate ratios increasingly reflect gains at the top - making leverage ratios look healthier even as financial strain builds among households and small businesses that capture little of that growth.
In short, the macro balance sheet may look better - but stress is definitely building in pockets.
The real test now is whether private-sector deleveraging can keep going while governments continue to carry the growing weight - without something eventually giving way.
Figure 2: St. Louis Federal Reserve, January 2026
The Productivity Paradox: Why Workers Produce More but Take Home Less
Since the late 1970s, productivity gains have increasingly flowed to capital instead of workers, breaking the historical link between higher output and higher pay and widening income inequality.
When wages lag productivity, growth becomes debt-dependent rather than income-driven, leaving the economy more fragile and fueling social and political strain over time.
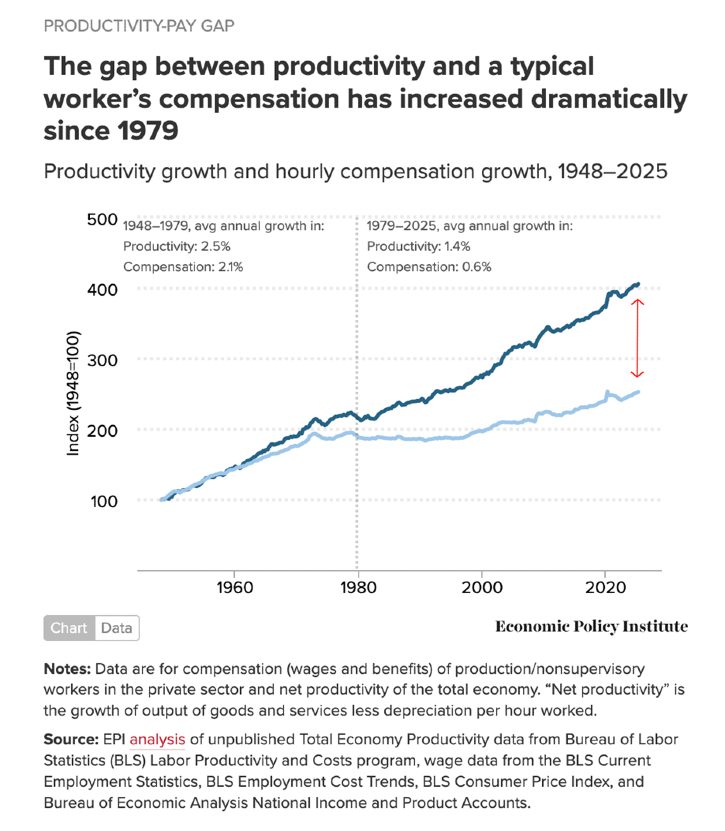
What you need to know: Since the late 1970s, U.S. productivity has surged - growing nearly three times faster than worker pay - fueling a widening gap between economic output and wages.
Why it matters: When wages fail to keep up with productivity, growth becomes unbalanced. Workers produce more but don’t earn more, which suppresses demand, concentrates wealth, and widens inequality as households depend more on debt to keep up. Over time, this type of imbalance can shows up in social strain, political polarization, and rising distrust in institutions that appear to favor capital over labor.
Now the Deep Dive: Longtime readers know I love stepping back and looking at long-term structural trends. And this is one of the most glaring ones right now.
I’m talking about the widening gap between soaring productivity and stagnant wages that’s gotten out of control since the late 1970s.
For decades before that, the relationship made sense.
Productivity and wages moved together. When workers produced more, they earned more. Thus, gains were broadly shared, consumption was funded by rising incomes rather than debt, and the economy expanded on a relatively stable foundation.
Then that relationship broke down. . .
According to the Economic Policy Institute (EPI)3, productivity has risen steadily since the late 1970s, while typical worker pay lagged behind. The economy became more efficient - but workers took home less of what they produced.
Why did this happen? A lot changed during that period.
The world moved fully into a fiat money system (aka broke from gold) - allowing money and credit to grow much faster than real output.
Globalization boomed - giving firms the ability to move production to lower-cost countries and putting downward pressure on domestic wages.
Labor unions were essentially neutered - reducing bargaining power for workers just as corporate profits were becoming a larger priority.
Technological growth had changed - with the major breakthroughs of the second industrial revolution (1870s–1920s) largely behind us. That doesn’t mean innovation stopped - far from it - but it became more concentrated and incremental, focused on making things faster and cheaper rather than fundamentally new (think “evolution,” not “revolution”). The gains favored specialized skills, concentrated wealth, and left broad-based wage growth behind
And financial markets run rampant - pushing companies to focus more on shareholders and capital returns rather than labor compensation.
Put simply, productivity gains didn’t disappear. They simply flowed into other pockets.
The result was an economy where workers produced more but ended up taking home a smaller slice of the pie.
And while that can be beneficial if you own capital or run a business - and far less so if you rely primarily on wages - it does carry consequences.
Because generally, when wages don’t keep pace with productivity, consumption must be financed. Meaning households increasingly rely on debt to maintain living standards because income growth alone isn’t enough.
Think of it this way - if consumption grows at 3% per year while wages grow at only 1%, the gap has to be filled somehow - through rising household debt, falling savings, or falling prices.
Well, firms rarely cut prices unless forced (which can crush margins and lead to layoffs, weak returns, etc), and the U.S. savings rate is already low - around 4% today versus roughly 12–15% in the 1970s4.
Thus, household debt became a defining feature of the modern economy - another symptom of stagnant wages.
And this can work – for a while. But debt-fueled demand is far more sensitive to interest rates, credit shocks, and confidence than income-driven demand. Thus why when borrowing slows, the economy tends to also (I’ve touched on this before in “Debt Cycles 101: Why Credit Is the Beating Heart of Economic Growth”).
Looking at the big macro picture, this helps explain why inequality has widened and why economic frustration has intensified. When productivity rises, but wages don’t, people feel left behind - even when headline data like GDP looks great.
Meanwhile, such economic imbalances can soon turn into feral political agendas.
The point is, an economy that grows without broadly sharing its gains becomes increasingly imbalanced and unstable over time.
And the longer the gap between productivity and pay persists, the more everyday people will feel like something is off.
Figure 3: Economic Policy Institute, October 2025
Anyway, who knows how this will all play out?
This is just some food for thought as we watch how these trends develop.
We’ll be keeping a close eye on things. Enjoy the rest of your weekend.
This communication is general in nature and provided for educational and informational purposes only. It should not be considered or relied upon as legal, tax or investment advice or an investment recommendation, or as a substitute for legal or tax counsel. Any investment products or services named herein are for illustrative purposes only, and should not be considered an offer to buy or sell, or an investment recommendation for, any specific security, strategy or investment product or service. Always consult a qualified professional or your own independent financial professional for personalized advice or investment recommendations tailored to your specific goals, individual situation, and risk tolerance.
Information contained in the materials included is believed to be from reliable sources, but no representations or guarantees are made as to the accuracy or completeness of information.
Dunham & Associates Investment Counsel, Inc. is a Registered Investment Adviser and Broker/Dealer. Member FINRA/SIPC. Advisory services and securities offered through Dunham & Associates Investment Counsel, Inc.