Content Editor, Dunham | 2025 ThinkAdvisor Luminaries Award Winner | 2026 Wealthies Finalist, Thought Leader of the Year | Macroeconomics, markets, geopolitics & global trends
Retail sales hit a record $763.7 billion in May 2026, but adjusted for inflation, real retail sales have gone nowhere since April 2021. Beneath the headline numbers, government transfer payments now fund nearly a fifth of personal income, the savings rate has fallen to some of its lowest levels outside the COVID era, and renters still haven't recovered the ground lost since 2015, even after two years of wages outpacing rent.
Key Takeaways:
Retail sales hit a record $763.7 billion in May — but adjusted for inflation, real retail sales have been flat since April 2021.
Government transfer payments now make up roughly 19% of real personal income, nearly $4 trillion a year, funded by deficits.
The personal savings rate fell to 3.0% in May 2026 — the lowest reading since the 2007–08 era outside of COVID.
Wages have outpaced rent since 2022, but the wage-to-rent ratio is still 10.6 points below where it started in January 2015.
Household net worth hit a record $174 trillion, though those gains are concentrated among Americans who already own stocks and real estate.
Listen to this blog here
12:25
“Everything looks fine. They keep spending.”
That's what you'll hear about the American consumer this month.
But “everything looks fine" is what a doctor says before the bloodwork comes back – which can tell us what’s really wrong.
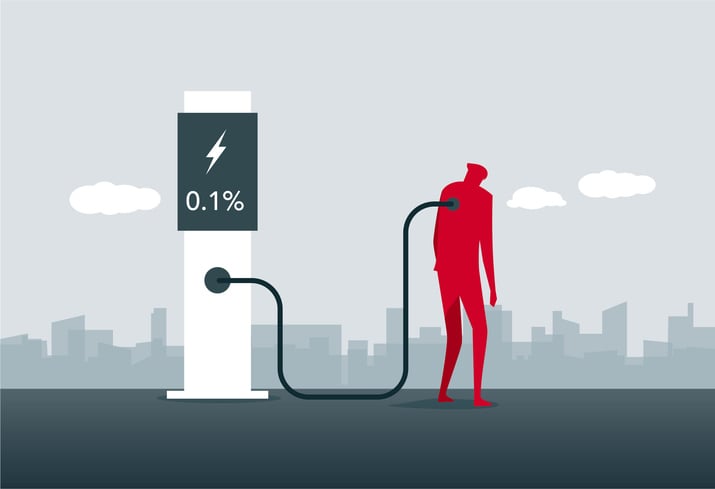
So we ran a full panel. Four vital signs on a patient who might be running on borrowed energy.
Nobody's saying the consumer is broke. And nobody's saying a recession is certain.
But these four numbers under the hood look a lot worse than the ones getting read out on the evening news - and that difference is worth understanding before the market figures it out first.
So - is the consumer healthy?
Vitals: yes.
Bloodwork: not so much.
The Checkup Model
Think about your last annual physical.
The nurse takes your blood pressure, checks your pulse, weighs you. Everything reads "normal." You leave feeling great.
Then the doctor calls a week later with the bloodwork - and suddenly "normal" needs context.
The U.S. economy gets the same exam every month. Vitals first - GDP, retail sales, the jobs number, inflation, etc.
Then bloodwork comes later. Real income. Savings. Debt. Delinquency trends. Etc.
That's the frame I’m using for this checkup.
Keep it in your head as you read the next sections - because every headline this year is a vital sign, and every asterisk behind it is bloodwork that needs a closer look.
Let's start with the one everyone's celebrating.
Is Retail Sales Growth Real, or Just Inflation in Disguise?
Retail sales up 6.9% year-over-year to a record $763.7 billion in May – which looks very impressive (especially in the face of higher gas prices).
But - once you adjust for inflation, real retail sales have been flat since April 2021 (aka it’s been over six years of zero inflation adjusted retail sales).
In fact, it’s the flattest it’s been since the 2005-08 great recession cycle.
Figure 1: St. Louis Federal Reserve, Dunham, July 2026
Picture your weekly grocery run. The bill climbed from $100 to $125 over a few years, but you're walking out with the same number of bags. That's the U.S. consumer. Spending more dollars just to buy the same stuff as 5+ years ago.
If you actually break down the math of that May record - roughly $605.9 of that $763.7 billion represents real goods in 2021 dollars. The other $157.8 billion is pure price inflation disguised as growth.
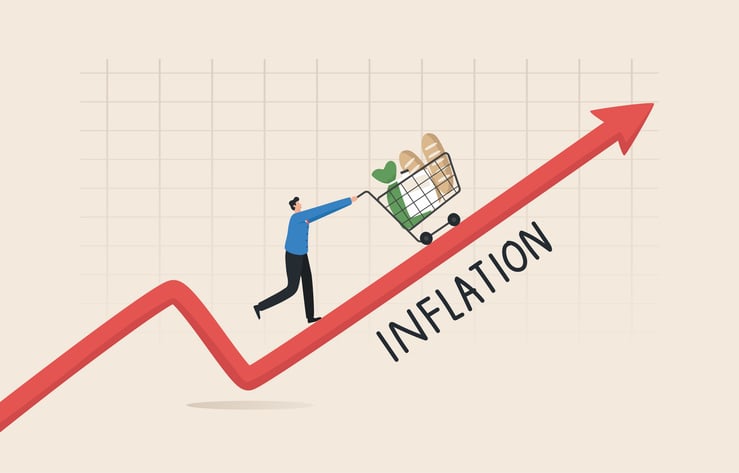
Put simply, Americans aren't buying more. They're just paying more for the same cart.
TheGood: Spending volume held up despite years of price pain - meaning nobody's cutting back in a panic like they did after 2008 or 2020.
TheBad: The "record" is a pricing illusion. Retailers aren't growing in real terms nor are consumers feeling fulfilled.
Ugly: Five years of flat real spending is a very worrying trend – one that looks increasingly like a ceiling.
What Are Government Transfer Payments, and Why Do They Matter Right Now?
Government spending has increasingly subsidized consumers – which is worrying as it implies “organic” income isn’t enough to sustain growth anymore.
We can measure this through real incomes vs real incomes excluding transfer payments.
Government transfer payments2 are essentially money Washington sends straight to individuals as subsidies (Social Security, Medicare. Medicaid, SNAP food stamps, welfare, unemployment insurance, etc.). Basically, it’s any check the government writes that didn't come from an employer.
Today, transfer payments account for roughly 19% of real personal income in the U.S. - more than double the roughly 8% share they represented in 1970. (and growing).
To put that into perspective, total real personal income ran about $20.5 trillion in May 2026. Strip out transfer payments and it drops to roughly $16.6 trillion. That gap - nearly $4 trillion(19.1%) - is income that exists only because the government wrote the check.
Figure 2: St. Louis Federal Reserve, Dunham, July 2026
But here are two big problems the mainstream never seems to cover on this topic.
First, the consumer now leans on the government to keep spending. Pull that $4 trillion out and income drops by that much overnight - and since people spend these checks the moment they land (more in next section), that's $4 trillion of demand that vanishes with it, dragging growth and corporate profits down together.
Secondly, Washington is borrowing to fund it. Picture the government writing $100 checks while only collecting $80 in taxes to cover them. That extra $20 doesn't come from savings - it gets created, effectively printed into the money supply3. Thus, more dollars chasing the same goods is inflationary - and that inflation is eating into real incomes. This means Washington has to send out even bigger checks next time just to keep consumers whole – thereby creating more inflation - and that feedback loop feeds on itself.
As long as the government keeps spending, income will rise. But it’s an ugly trend showing that organic income growth requires support – at an ever-faster pace.
The Good: The safety net is doing what it’s supposed to do, subsidizing Americans and boosting real incomes.
The Bad: A growing share of "consumer strength" is government-supported and deficit-funded
The Ugly: This bill doesn't disappear. It gets forwarded to whoever's paying taxes in twenty years while creating more inflation in the meantime.
Why Is the Personal Savings Rate So Low?
It’s no surprise that since 2020, inflation and debt have been outpacing wage growth most of the time, forcing households to save less just to keep up.
Well, the personal savings rate (the share of after-tax income people set aside) fell to 2.8% in May 2026, before dipping further to 2.6% in June and ticking back up to 3.0% in July - among the lowest readings outside the COVID era in decades.
Put simply, Americans are saving about $3 out of every $100 they take home. The historical norm is closer to $6 to $12 (depending on the decade).
Zoom out, and the slide looks worse. The 1970s averaged a 12.2% savings rate. The 1980s ran 9.8%. Even the 2010s - not exactly a golden decade - still managed 6.1%.
We're now parked less than half that.
Figure 3: St. Louis Federal Reserve, Dunham, July 2026
A savings rate this thin usually means one of two things - either households are wildly confident about the future so they’d rather spend now and expect earnings to keep growing.
The Good: Rock-bottom savings rates mean consumers are spending - fueling growth.
The Bad: Personal savings have fallen sharply - leaving households with almost no buffer - and historically happen before a recession.
The Ugly: A near-record-low savings rate, a relatively weak job market, and still-sticky inflation are not a combination that ages well.
Are Wages Keeping Up With Rent in 2026?
A big sticking point for many Americans dealing with unaffordability has been housing costs.
Mortgage rates get most of the spotlight. But about a third of the entire U.S. population rents - and for them, the number that matters most isn't a 30-year fixed rate. It's the wage-to-rent ratio.
The wage-to-rent ratio measures how far a paycheck stretches against rising rent. When the ratio rises, wages are outpacing rent and renters gain ground. When it falls, rent is outpacing wages and renters get burned.
After a decade-long slide, wage growth has outpaced rent growth since mid-2022 - but the recovery hasn't come even close to erasing the damage.
Track average hourly earnings against national rent since January 2015 and the line shows us something troubling.
It's been sliding almost the entire decade.
By August 2022, the wage-to-rent ratio had fallen to its lowest level - 84.8. That means the average paycheck bought roughly 15% less rent than it did seven years earlier.
Figure 4: St. Louis Federal Reserve, Zillow Housing Data, Dunham, July 2026
But since that 2022 low, the line has turned higher.
Wages have outpaced rent for a genuine, sustained stretch - thus the ratio now sits at 89.4, its best level since 2021.
The problem is it’s still10.6 points below where this ratio started in January 2015 – meaning two years of wage gains have clawed back less than half of what a decade of rent growth took away.
Think of it like a treadmill that's been running too fast for years. Someone finally dials the speed back a notch. That doesn't mean you've caught your breath - you're still gasping from everything that came before.
This is something to monitor and helps give a clearer picture of the overall consumer picture.
The Good: Wages have out-earned rent for a real, multi-year stretch since the 2022 bottom (albeit choppy).
The Bad: Even after that recovery, the average paycheck buys noticeably less rent than it did in 2015.
The Ugly: The 2020–2021 whiplash - a spike, then a crash to a fresh low - shows how fast this ratio can reverse when rents run hot again.
Is There Any Good Economic News for U.S. Consumers Right Now?
Short answer: yes, two things - record household net worth and a labor market that's still adding jobs, though both come with real caveats.
Fair's fair. Two numbers on this chart actually look good.
Household net worth is sitting at a record high of $174 trillion - driven largely by stock and real estate.
Figure 5: St. Louis Federal Reserve, Dunham, July 2026
Of course, this is just total net worth. And it’s disproportionately benefited5 those who hold stocks and real estate (the haves) while those who don’t (the have-nots) were left behind.
Meanwhile, the labor market - while cooling - hasn't collapsed as many expected.
May's initial jobs print of 172,000 got revised6 down to 129,000, and June slowed further to just 57,000, with unemployment dipping to 4.2% (mostly because people left the labor force7 rather than found jobs).
So while it’s weak, it still is positive.
So — Is the U.S. Consumer Actually Healthy?
Thus far, the vitals have come back clean.
Record retail sales. A jobs market that's still adding positions. And household wealth that keeps hitting new records.
Yet, the bloodwork says something else.
Real retail sales have gone nowhere in five years.
Transfer payments are doing more and more of the lifting - funded by deficits nobody's voting to pay down.
The savings cushion just hit its lowest level since the 2008 era (outside of COVID) while debt delinquencies climb right alongside it.
And even after two years of wages outpacing rent, the average paycheck still buys noticeably less rent than it did back in 2015.
Keep in mind that bloodwork can influence future vitals. Not the other way around.
Now, don’t expect any of these four numbers to make it onto CNBC tonight.
And that's exactly the point.
Bloodwork doesn't make the evening news. It just decides how the next recession (if there is one) can actually play out.
So yes - fine on the vitals. And worth a second opinion on the bloodwork.
Just some food for thought.
Frequently Asked Questions About US Consumer Health In 2026
Are US retail sales actually growing, or is it just inflation? Retail sales hit a record $763.7 billion in May 2026, up 6.9% year-over-year, but that number isn't adjusted for prices. Once you strip out inflation, real retail sales have been essentially flat since April 2021. Americans are spending more dollars, but they're not buying meaningfully more stuff.
How much of US personal income now comes from government transfer payments? Government transfer payments, like Social Security, Medicare, Medicaid, and unemployment insurance, make up roughly 19% of real personal income in 2026, more than double the 8% share seen in 1970. That gap, nearly $4 trillion a year, is income tied to government spending rather than wages or business activity, and it's increasingly funded by federal deficits.
How low is the US personal savings rate right now? The personal savings rate dropped to 2.8% in May 2026 and 2.6% in June, among the lowest readings outside the COVID era in decades, before rising slightly to 3.0% in July. Compare that with the historical norm of 6% to 12% across most prior decades, and households clearly have a much thinner financial cushion than they used to.
Have wages kept up with rent since 2022? Wages have grown faster than rent since mid-2022, pushing the wage-to-rent ratio to its best level since 2021. That said, this recovery only claws back part of what was lost the decade before. The ratio still sits well below its January 2015 level, so a paycheck buys noticeably less rent than it did ten years ago.
Is the US labor market still healthy in 2026? The labor market is cooling but hasn't fallen apart. May payrolls were revised down from an initial 172,000 to 129,000, and June slowed further to just 57,000 new jobs, while unemployment held at 4.2%. Labor force participation dropped to 61.5% in June, the lowest reading outside the pandemic in roughly 50 years, partly because workers are leaving the labor force rather than landing new jobs.
Sources:
Yahoo Finance — Retail sales surge to record $763.7 billion [finance.yahoo.com]
Dunham — The rise of fiscal dominance [dunham.com]
Federal Reserve Bank of New York — Household Debt and Credit Report [newyorkfed.org]
Dunham — Wealth effect and retirement sequence risk [dunham.com]
PBS NewsHour — U.S. employers pulled back on hiring in June [pbs.org]
Fortune — Labor force participation hits lowest level in 50 years [fortune.com]
Disclosures:
This communication is general in nature and provided for educational and informational purposes only. It should not be considered or relied upon as legal, tax or investment advice or an investment recommendation, or as a substitute for legal or tax counsel. Any investment products or services named herein are for illustrative purposes only and should not be considered an offer to buy or sell, or an investment recommendation for, any specific security, strategy or investment product or service. Always consult a qualified professional or your own independent financial professional for personalized advice or investment recommendations tailored to your specific goals, individual situation, and risk tolerance. All examples are hypothetical and are for illustrative purposes only.
Information contained in the materials included is believed to be from reliable sources, but no representations or guarantees are made as to the accuracy or completeness of information. This document is provided for information purposes only and should not be considered as investment advice.
Dunham & Associates Investment Counsel, Inc. is a Registered Investment Adviser and Broker/Dealer. Member FINRA/SIPC. Advisory services and securities offered through Dunham & Associates Investment Counsel, Inc.
Is the US Consumer Healthy in 2026? 4 Warning Signs | Dunham