Business Analyst, Dunham | B.S. Financial Services, SDSU.
Listen to this blog here
7:20
Key Takeaways
The top 20% of earners drive 57% of U.S. consumption — and own 87% of all equities held by the public. Spending and the stock market are now deeply linked.
Household net worth has grown significantly faster than real wages since 2006.
When portfolios fuel spending, aggregate consumption becomes sensitive to market swings. I call this Consumption Beta — and in a K-shaped economy, it's rising.
A market correction isn't just a portfolio event anymore. It can be the trigger for an economic contraction.
For clients near or in retirement, sequence risk has more variables than it used to. If they haven't stress-tested their spending against a multi-year drawdown, now is the time.
The K-Shaped Economy Explained
The K-shaped economy isn’t news to anyone.
Take airlines. Premium seats have grown nearly 3x faster than economy since 20201, as carriers reallocate space away from the price-sensitive flyer.
Sales didn’t falter, they just shifted to higher margin customers.
That’s exactly what’s happened all across the U.S. economy.
The top 20% of earners now account for roughly 57% of all consumption2. And just like airlines, most businesses are leaning into that concentration – centering products around their most “resilient” customers.
But the growing consumer dichotomy has second-order effects – ones that matter directly to your clients’ portfolios.
Who is the “Golden Customer”
Look closely at the high-end consumer that businesses have catered to in hopes of lower elasticity and greater profits.
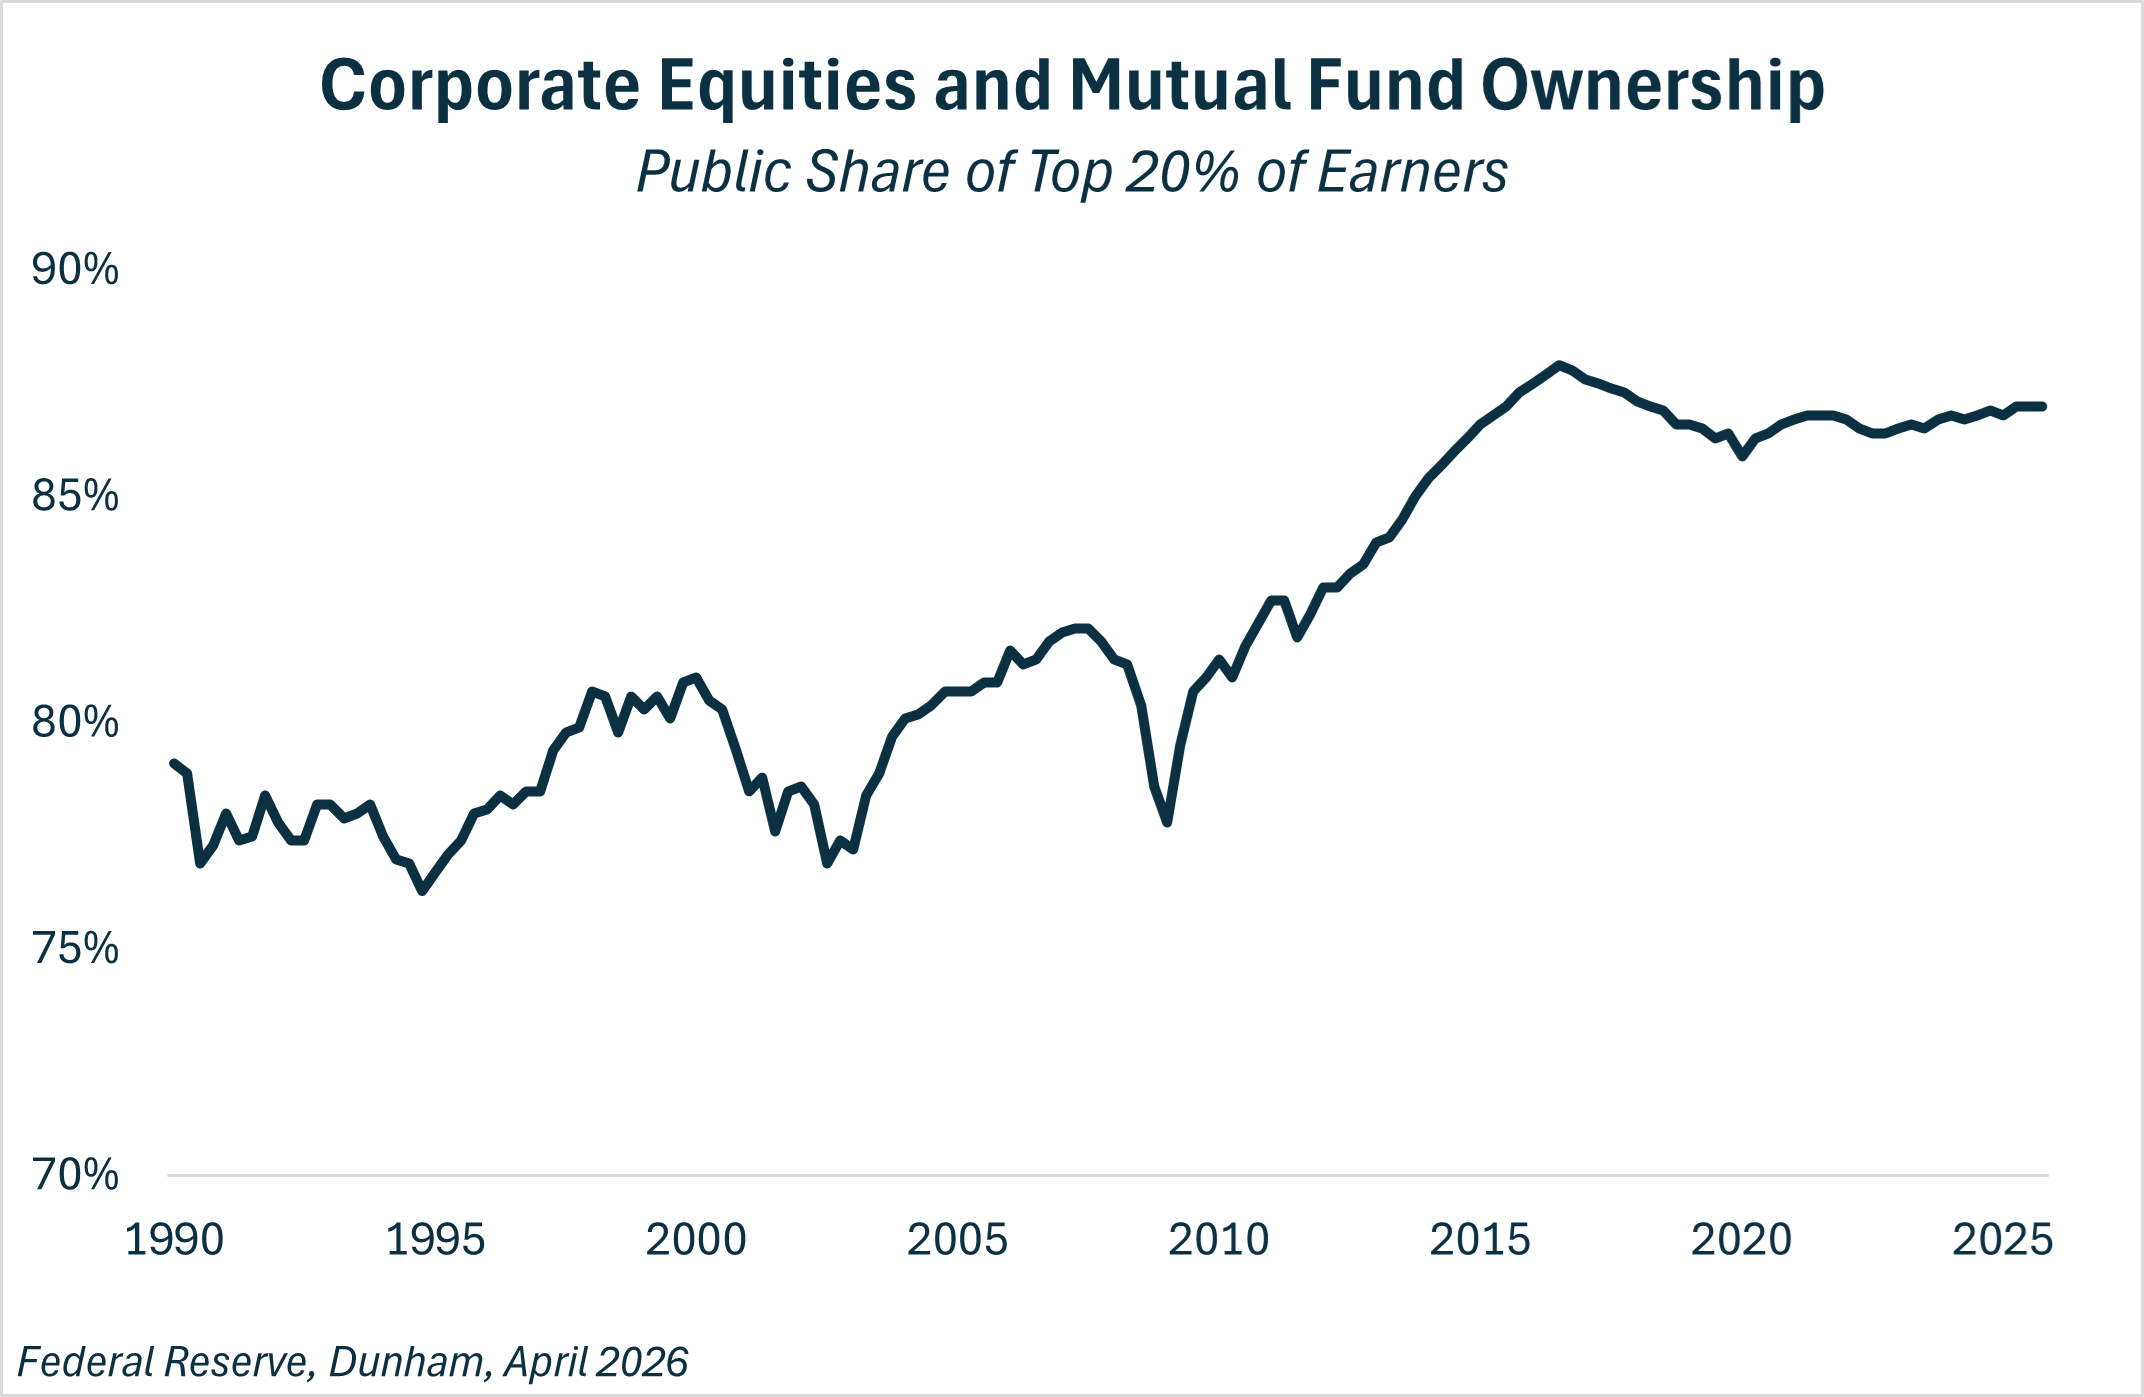
As of 2025, the top 20% of earners own 87% of all corporate equities and mutual fund shares held by the public – up from 78% in the 1990s3.
This implies that the “golden customer”, in aggregate, is heavily exposed to the stock market.
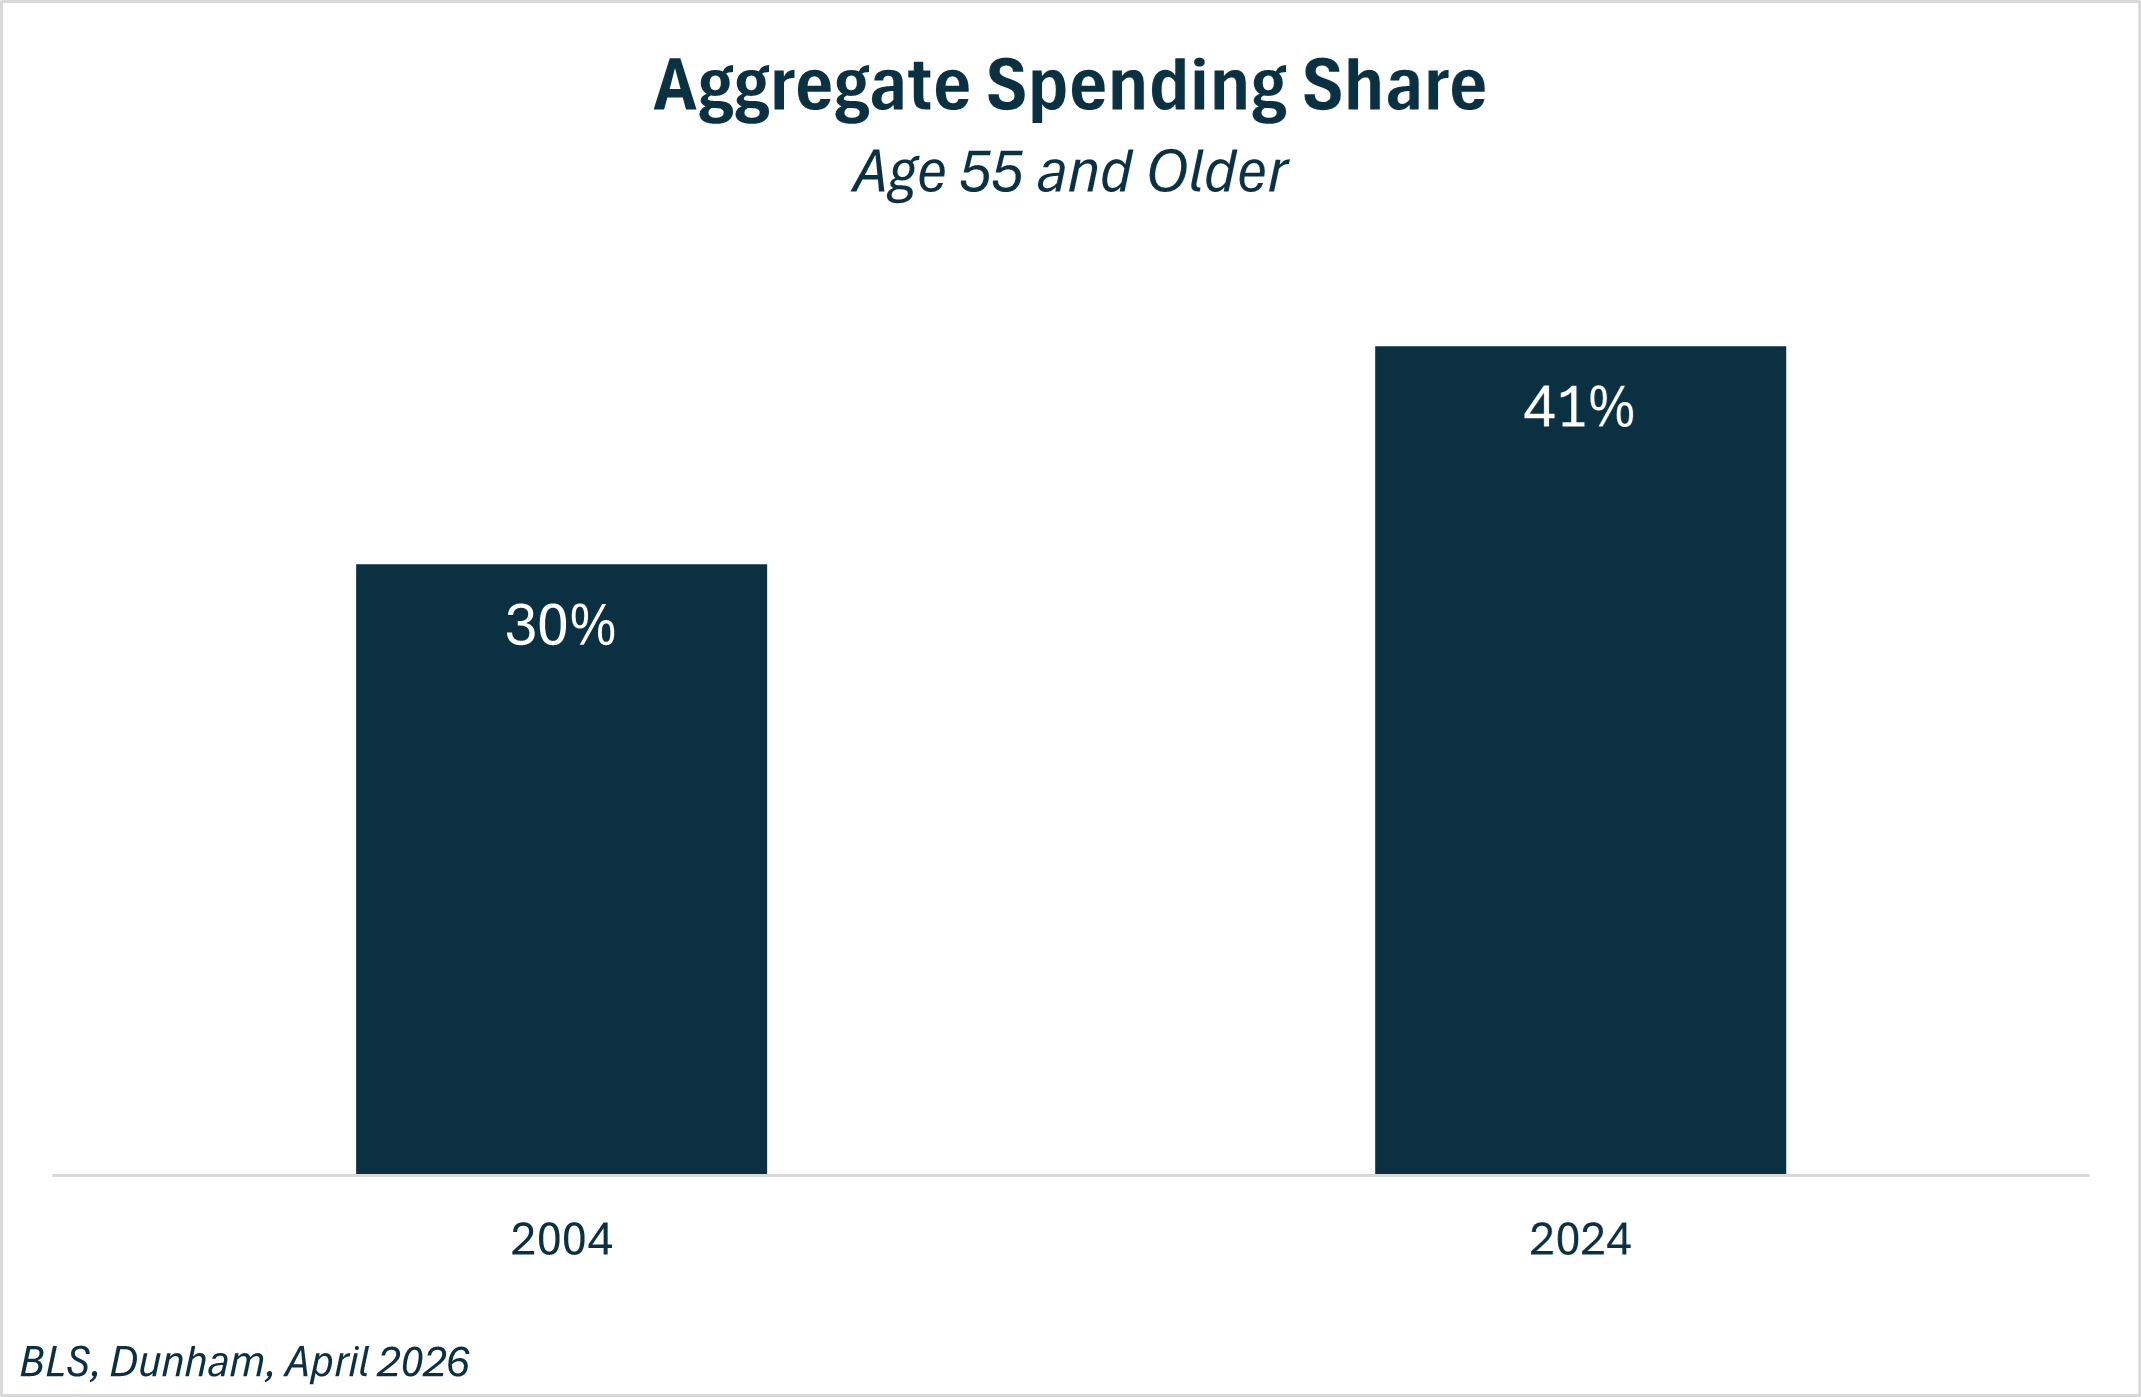
They’re also older. Americans aged 55+ accounted for 41% of all spending in 2024 – up from 30% two decades ago4.
Put that together and the marginal driver of consumption is narrowing around a particular group: older, asset-heavy households.
How The Wealth Effect Works
The story goes that for every $1 increase in wealth, consumers spend about 3 to 4 cents more. But that relationship isn’t uniform.
Consider a near-retirement household that has let equity gains compound over the past five years. Despite much of that wealth being unrealized, they naturally watched their discretionary spending climb even as their income remained flat. A 20% drawdown in the broader stock market is likely to substantially alter this family’s spending habits.
That near-retiree example may be a bit extreme. But the behavior – and its leveraged effect on aggregate consumption to the upside and downside – still holds.
Why the “Resilient” Consumer is Actually Fragile
On the way up, the wealth feedback loop boosts consumption. Asset gains, vastly concentrated in the top 20% of earners, translate into marginal spending. Which insulates a consumer economy facing a widening K-shaped divergence.
But at a certain point, overall consumption can lean too heavily on a group branded as ultra-resilient but is fragile in the face of a (paper) wealth shock.
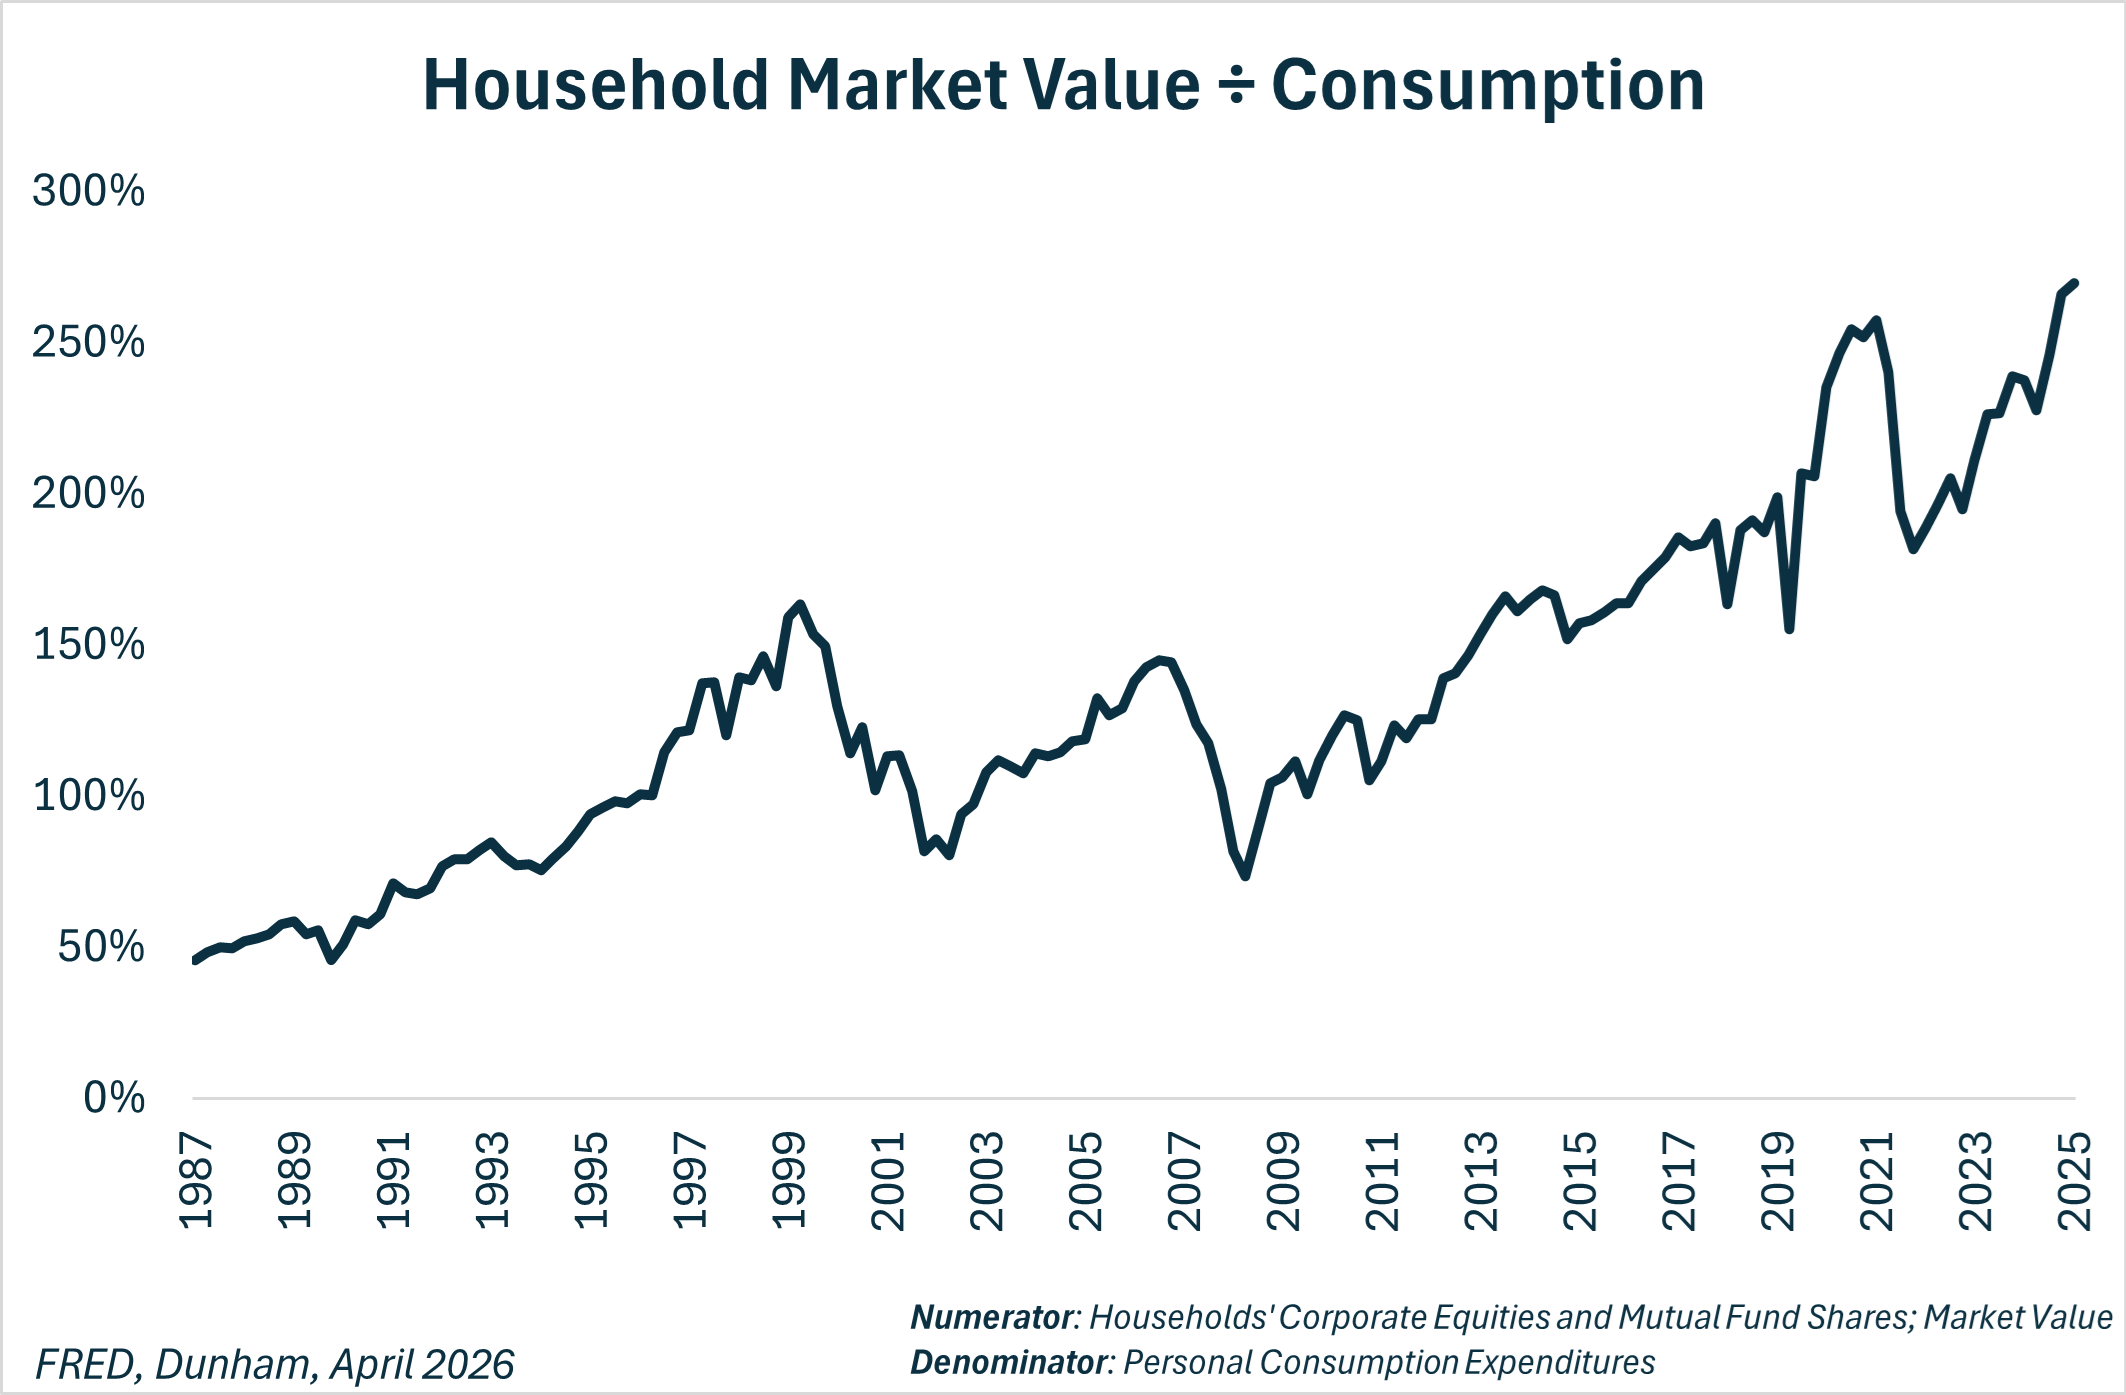
At the height of the dot-com bubble, household equity and mutual fund value represented 160% of total consumption. Today, it equates to more than 270%5.
Balance Sheet Rich
The upper class has benefited from a near-constant tailwind from the U.S. stock market since the Great Financial Crisis – driving the cohort’s share of both consumption and equity ownership to historic highs.
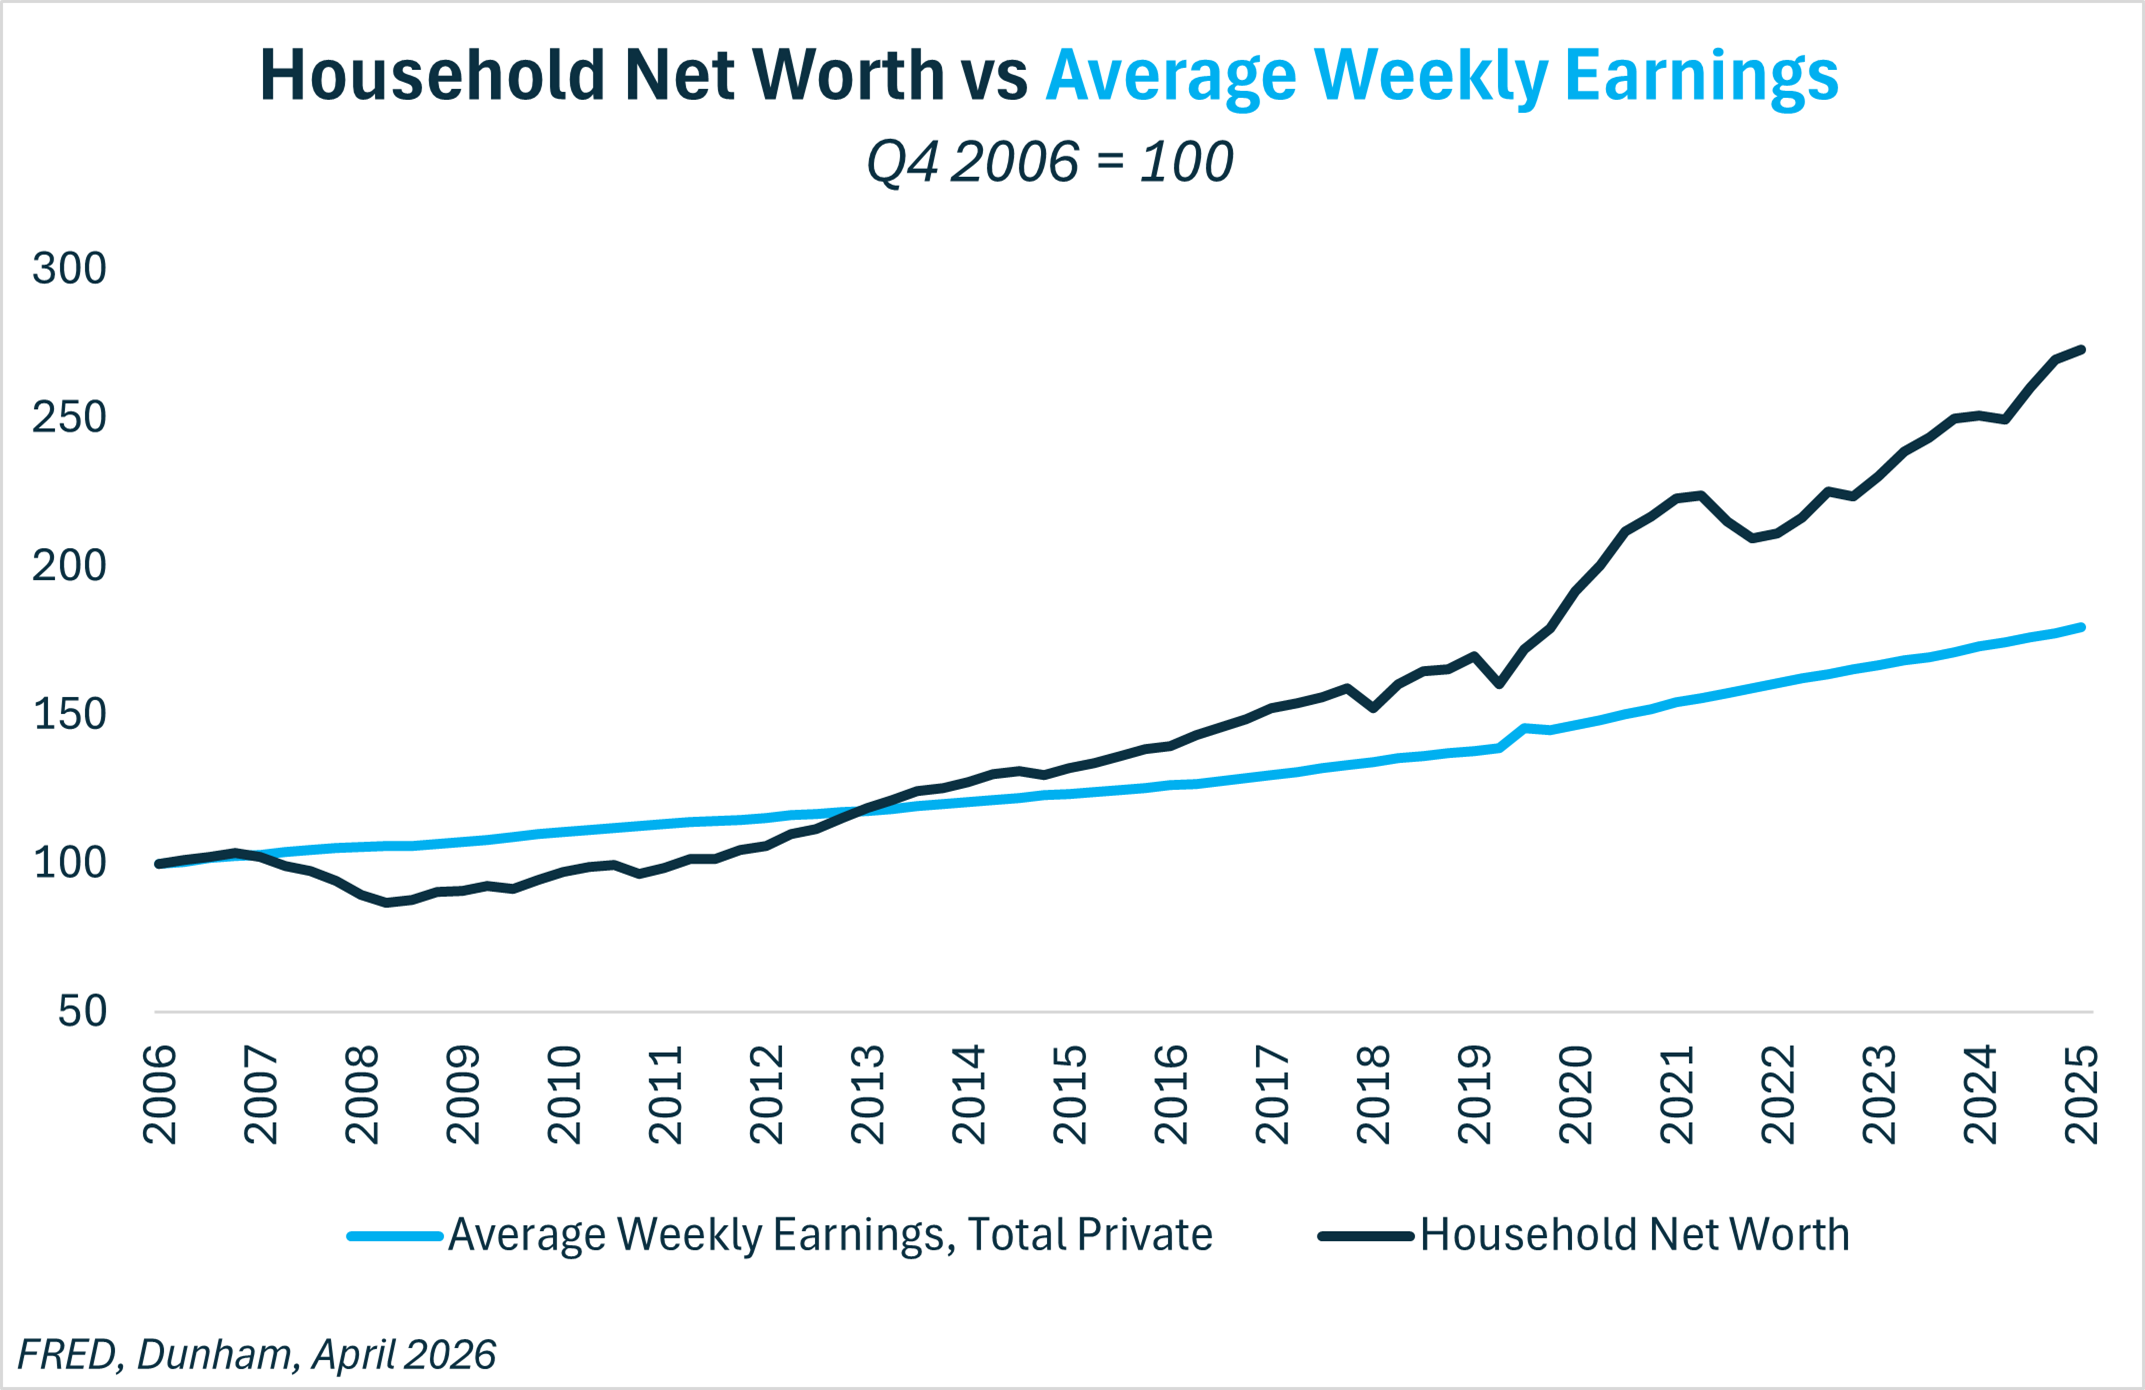
Meanwhile, inflation-adjusted income for the average American has been sluggish, growing just 9% since the GFC ended (Q3 2009)6.
Since 2006, household net worth has significantly outpaced earnings growth7. That’s the divergence between core earning power and asset value.
The Paper Wealth Flywheel Driving Consumption
The divergence has molded into the infamous K-shaped economy. And with it, an asset-fueled feedback loop: businesses rely on the Upper-K’s marginal spending, that spending is fueled by an equity bull market, and the bull market, in turn, relies on the marginal earnings those businesses generate.
The U.S. economy has been frequently described as resilient since the Covid recovery. But one key resiliency metric that has lagged is consumer breadth.
Ideally, spending would be reflexive to real earnings growth – since income is sticky. While assets can be quite volatile, especially stocks.
Prior to economic downturns, markets have generally been able to signal deterioration early on. But in this new dynamic, it’s becoming increasingly likely for a correction to be the source of a contraction.
Earning-less Spending during the Dot-Com Bubble
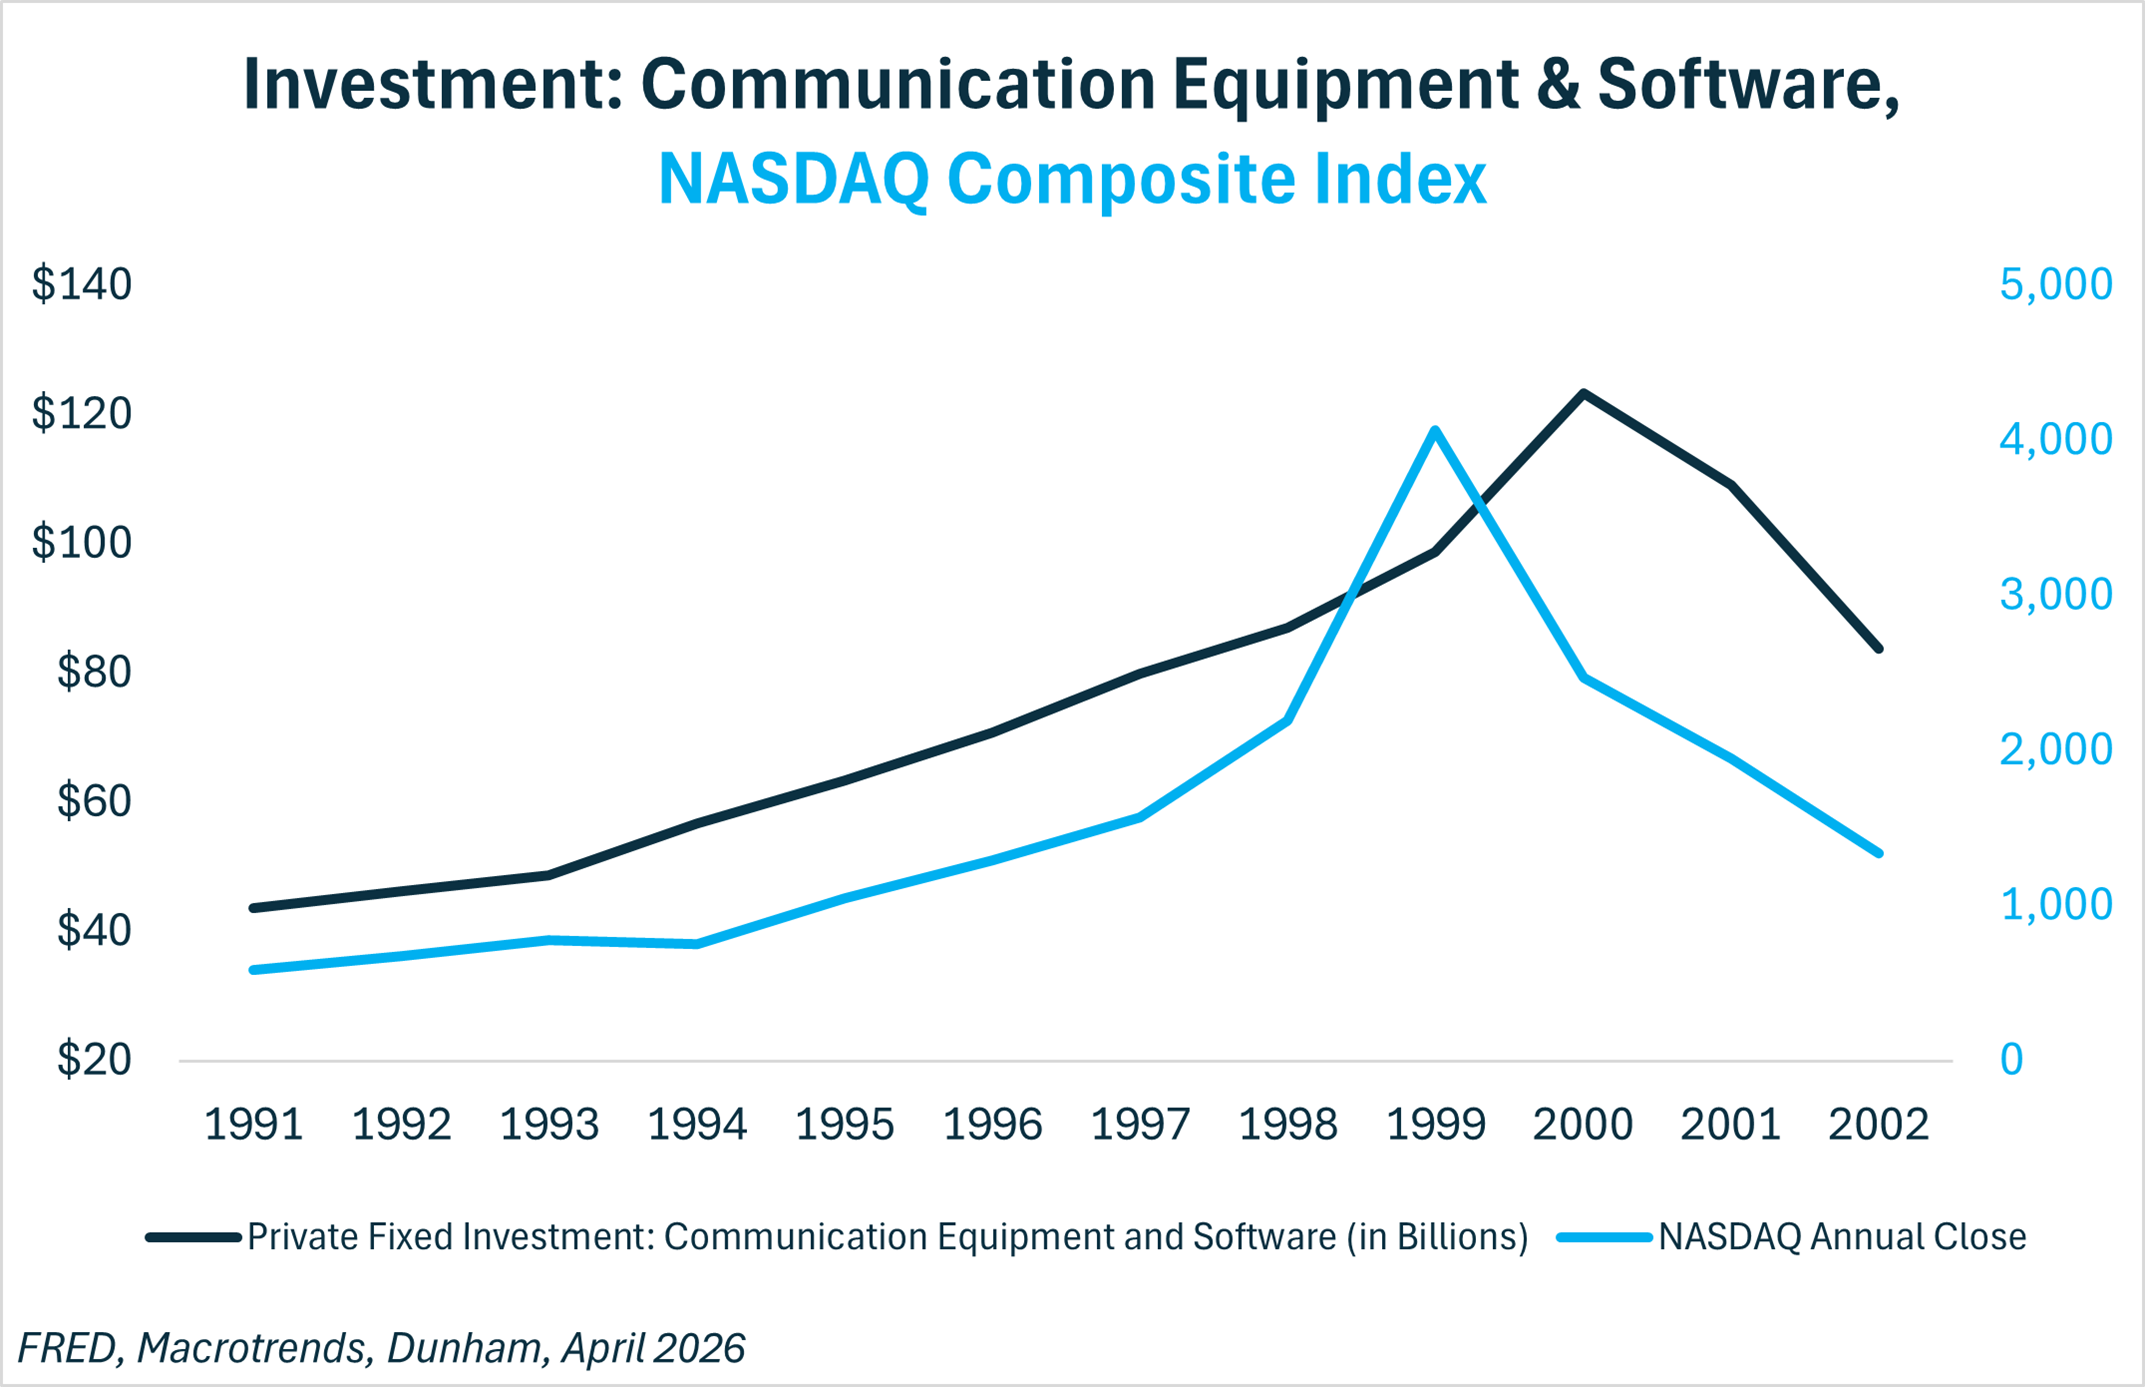
We’ve seen variations of this before. During the dot-com bubble, consumption surely got a boost from the NASDAQ Composite Index quadrupling in just a few years. But the real wealth effect was felt by corporations.
Private investment in communication equipment and software nearly tripled between 1991 and 2000. Not from recycling profits, but from cashing in on IPOs and rising stock values.
When the bubble popped, we saw corporations quickly unwind this fragile spending – investment fell by 32% in just two years8.
Consumption Beta: The Hidden Risk in a Bull Market
For a consumer economy to be truly resilient, spending needs to be sticky. And for spending to be sticky, it needs to be derived from real earnings – not paper gains.
When spending share concentrates around those fueled by their stock portfolio, a concept I’ve dubbed Consumption Beta emerges.
Consumption Beta is how sensitive aggregate spending is to the stock market.
In a K-shaped economy, Consumption Beta rises – meaning, the perceived resiliency during a bull market is actually just growing fragility.
What This Means for Retirement Planning and Sequence Risk
This is where the macro picture becomes personal.
Spending habits and forecasts need to be based on a relatively secure cash flow.
Once the anticipated portfolio gains start creeping into spending, the investor’s lifestyle becomes market dependent.
For clients nearing retirement, stress testing their spending profile is vital. If a multi-year drag in the S&P 500 would require a lifestyle reaction, that could imply living above their means.
For clients early in retirement, the nest egg faces sequence risk – an extra layer of complexity.
If the upper-K concentration has grown so extreme that a stock market correction could potentially trigger an economic contraction, then we have more prongs threatening the nest egg than usual.
Mitigating sequence risk is crucial – whether it’s cash equivalent reserves, bucket strategies, or effective diversification. Early retirees and their advisors should be monitoring mitigation strategies more than ever.
Built for Markets Like This
When Spending Runs on Paper Wealth, the Margin for Error Shrinks
Consumption Beta is rising. The economy leans on a narrow group of asset-heavy households — and their spending moves with the market. That makes a correction more than a portfolio event. It makes it a macro risk.
For clients near or in retirement, that's exactly where DunhamDC earns its place — a rules-based, algorithm-driven strategy built on one principle: buy fear, sell greed. When sentiment shifts, the model acts. No emotion. No hesitation. No "stay the course and hope."
Sequence risk is hardest to recover from in the early years of retirement. DunhamDC is designed for the corrections that create it — and built to take advantage of what comes after.
This communication is general in nature and provided for educational and informational purposes only. It should not be considered or relied upon as legal, tax or investment advice or an investment recommendation, or as a substitute for legal or tax counsel. Any investment products or services named herein are for illustrative purposes only and should not be considered an offer to buy or sell, or an investment recommendation for, any specific security, strategy or investment product or service. Always consult a qualified professional or your own independent financial professional for personalized advice or investment recommendations tailored to your specific goals, individual situation, and risk tolerance. All examples are hypothetical and are for illustrative purposes only.
Information contained in the materials included is believed to be from reliable sources, but no representations or guarantees are made as to the accuracy or completeness of information. This document is provided for information purposes only and should not be considered as investment advice.
Dunham & Associates Investment Counsel, Inc. is a Registered Investment Adviser and Broker/Dealer. Member FINRA/SIPC. Advisory services and securities offered through Dunham & Associates Investment Counsel, Inc.