Business Development Associate, Northwest Region | Dunham | B.A. Finance & International Business, USD
Key Takeaways
The business cycle is the recurring pattern of economic expansion and contraction — but it runs on no fixed clock. Contractions can last two months. Expansions can last a decade.
Economic indicators fall into three categories: leading (where the economy is headed), coincident (where it stands today), and lagging (confirming what already happened).
Indicators measure pressure and probability — not certainty. Policy, fiscal stimulus, and structural forces like AI investment can override what the data signals.
The ratio of leading to coincident indicators has fallen to 0.84 — matching the 2008 Financial Crisis low — while the S&P 500 PE ratio sits at a 5-year high of 32.04.
Understanding cycle positioning does not replace advice. It creates the context advisors need to keep clients grounded when fear or greed takes over.
Business cycles always repeat. They never repeat exactly the same way twice.
Financial markets do not move in isolation.
Stock prices reflect more than supply and demand - they respond to the same economic forces shaping hiring decisions, interest rates, and business investment across entire industries.
Those forces move in patterns. Specifically, in cycles.
Boom to bust. Bust to boom.
That recurring pattern is the business cycle, and understanding where the economy sits within it gives you the context you need when a client calls wanting to sell near the bottom or buy more at the potential top.
It will not predict the future. Nothing will. But it will help you explain the present, contextualize the past, and help forecast the future trend – all while keeping clients grounded for what may come next.
The Economic Cycle Explained
The business cycle describes the recurring pattern of expansion and contraction in overall economic activity.
Think of it like a roller coaster which goes up and down and is highlighted by peaks at the top of an expansion and a trough at the bottom of a contraction.
During the expansion phase, economic activity builds on itself. Employment grows, incomes rise, business investment picks up, and consumer demand stays strong. Borrowing conditions tend to be more favorable early in the cycle - which supports hiring, capital spending, and R&D.
And as things heat up, inflation often follows. Policymakers respond by raising interest rates or taxes to slow demand - and many of the same activities that drove expansion begin to slow.
Here is what matters for your clients - this cycle always reoccurs, but it is not periodic.
There's no fixed timeline. Contractions can last two months or two years. Expansions can run for a decade (or even longer). What that means is that nobody rings a bell at the top or the bottom - and that's exactly why clients need context to understand the ebb and flows.
As Jamie Dimon put it: "No one has the right to not assume that the business cycle will turn. Every five years or so, you have to assume that something bad will happen."
Understanding Economic Indicators
Because the economy does not move in a straight line, economists and investors rely on indicators to help interpret where conditions are now and where they may be headed.
Economic indicators fall into three categories: leading, coincident, and lagging.
Leading Indicators
Leading indicators tend to precede changes in the cycle of the economy. Forward-looking metrics such asinterest rate spreads and consumer expectations can be used to gauge the direction the economy is headed.
Some examples would be:
Interest rate spreads
Employment growth
Wholesale orders
Building permits
Hours worked
GDP growth
Payroll employment
Wage growth
If weekly hours in manufacturing are increasing or there is growth in building permits, it might be a sign the economy is set to recover. On the other hand, weakening orders, tightening credit spreads, and declining business investment may point to a future slowdown.
For your clients, this is the early warning system.
Because when leading indicators deteriorate across the board, it is worth having a conversation. It does not mean selling everything, but it helps show them what momentum is building and why their long-term allocations may need adjusting.
Coincident Indicators
Coincident indicators follow the economy hand in hand as it changes.
Think of it as a thermometer for the current economy. Not super useful for predicting change, but useful in understanding where it currently is.
Notable examples include:
GDP growth
Payroll employment
Wage growth
These indicators provide a real-time snapshot of economic conditions.
So, when a client asks, "how is the economy doing right now?" - coincident indicators are the answer.
Lagging Indicators
Finally, lagging indicators trail the economy after changes have occurred.
They are useful backward-looking measures that can confirm trends in the economy.
The Consumer Price Index is a fitting example of a lagging indicator as inflation often peaks after the economy has already begun to overheat. This means they can serve as confirmation of previous theories derived from forward-looking metrics, such as leading indicators.
An effective way to think about these indicators is the relationship between an earthquake and a tsunami. When an earthquake happens in the ocean, it is an indicator that a tsunami might be coming. This gives you time to plan in anticipation of the event. Once the tsunami gets close to shore, the time to prepare has ended. Finally, when the tsunami hits, the event has already occurred, and you see the signs in hindsight.
Why Economic Indicators Are Useful but Imperfect
A problem with these indicators is that they measure the probabilities of a change, not a guarantee.
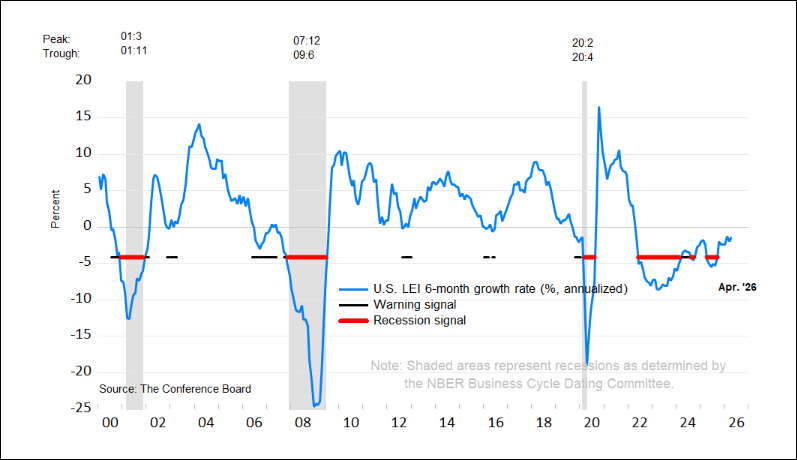
The Conference Board makes a leading economic index (LEI) to detect when economic conditions match past pre-recession environments. When enough indicators such as manufacturing orders, housing permits, and the yield curve deteriorate at the same time, the index signals a downturn is likely.
However, “likely” does not mean inevitable.
The LEI signaled recession conditions have been present for most of the past several years, yet no formal downturn materialized since the brief downturn in 2020.
In fact, it was the shortest recession in US history1 which only lasted two months. This may appear to be a failure of the indicators' predictive value, but it highlights that indicators measure underlying economic pressure, and policy heavily influences that trajectory.
The LEI’s six-month growth rate continued to be less negative relative to when it triggered the recession signal in September 2025.
Figure 1: US Leading Indicators2
In this case, post 2021, the index correctly captured tightening financial conditions and slowing forward momentum. Amid aggressive interest rate hikes, weak housing activity, and tighter bank lending standards.
However, the index includes a basket of statistics that can be offset by factors such as consumer expectations and equity prices.
The primary reason for this recovery was the unprecedented policy response3 following the COVID-19 pandemic and the AI boom.
Between 2020 and 2021, $5 trillion was injected into the U.S. economy through various federal programs. This resulted in deficits of 14.9 percent of GDP in 2020 and 12.4 percent of GDP in 2021, the highest ratios seen since World War II.
This massive influx of liquidity fundamentally altered the trajectory of the disrupted economic cycle:
Total nonfarm employment increased 16.25%5 from 2Q2020 to 2Q2021.
This influx of capital combined with the rise of AI caused the economy to rotate instead of collapsing. Housing, manufacturing, and regional banks all weakened while technology capex and government spending strengthened, helping the economy stay propped because of business and government expenditure even though consumer confidence fell, and CPI increased.
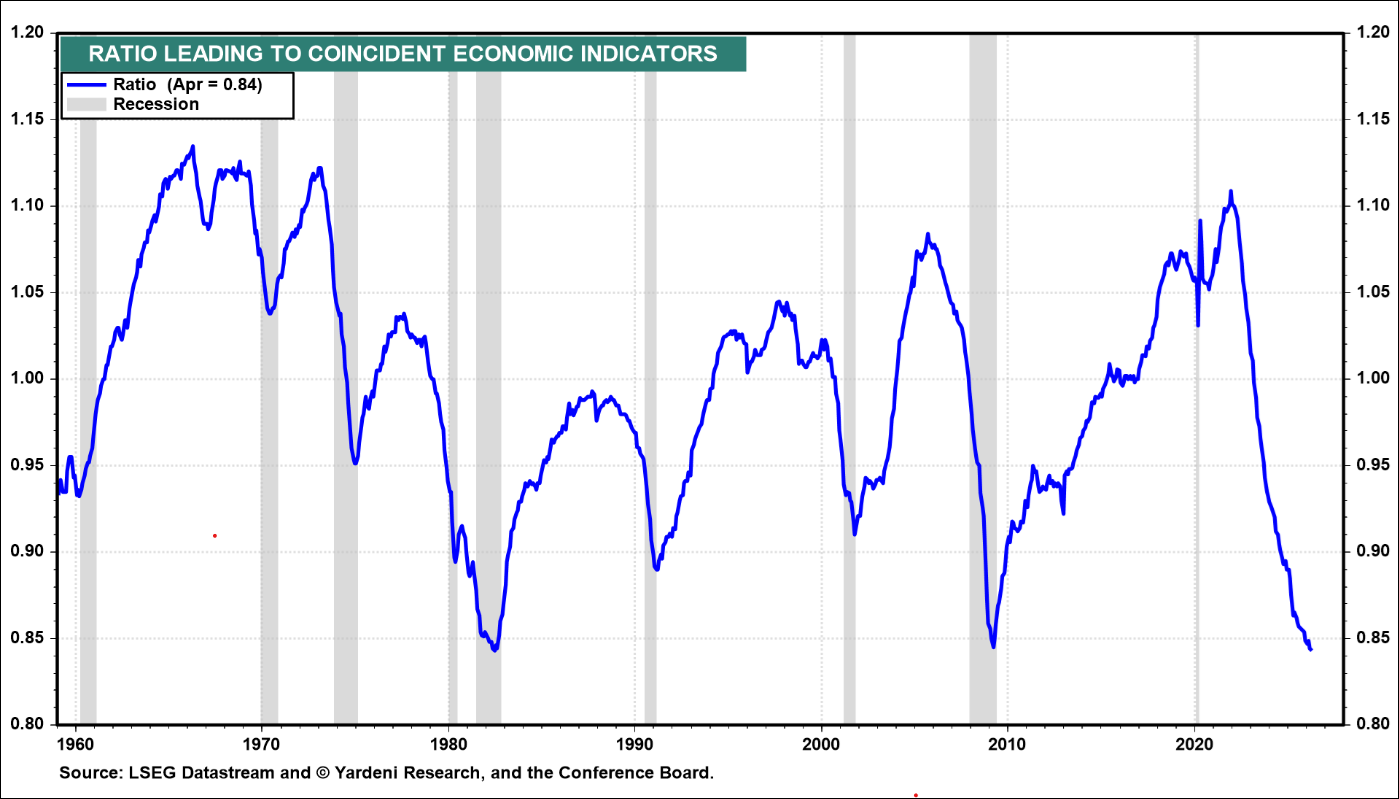
The ratio of the US leading to coincident economic indicators is now down to 0.84 - matching the 08 Financial Crisis low.
A ratio below 1.0 indicates a “contractionary divergence,” where leading growth drivers have slowed so significantly that they are now actively dragging down the current economy’s strength.
This comes as the Leading Economic Index (LEI) fell -0.6% MoM in March - posting its 7th MoM decline out of the last 8.8
Thus, this ratio is now on track for its 5th consecutive annual decline, the longest streak on record.
Meanwhile, the PE ratio of the S&P 500 has risen to a 5-year high of32.049 as of May 13th, 2026.
If it were not for the massive AI Capex by a handful of firms and fiscal spending, GDP would likely be flat/negative. This would create a drastically different market condition than what we are currently experiencing.
Conclusion
Financial markets are complex, but indicators can offer a valuable tool for making an informed opinion.
They help investors, businesses, and households understand where pressure is building, where momentum is improving, and where risks may emerge.
Leading indicators can offer early warning signs; coincident indicators help measure present conditions, and lagging indicators can confirm trends after they occur.
However, no single factor can fully capture the complexity of the economy. Policy decisions, consumer behavior, technological shifts, and unexpected global events can all alter the path of the cycle.
And that gap - between what prices imply and what the data shows - is exactly where these conversations become valuable. They help explain why the present moment looks the way it does, and what historical precedents suggest about what tends to follow.
There is no crystal ball in economics or markets - but business cycles may be as close as we can hope for.
They always repeat. Just never quite the way we expect them to.
This communication is general in nature and provided for educational and informational purposes only. It should not be considered or relied upon as legal, tax or investment advice or an investment recommendation, or as a substitute for legal or tax counsel. Any investment products or services named herein are for illustrative purposes only and should not be considered an offer to buy or sell, or an investment recommendation for, any specific security, strategy or investment product or service. Always consult a qualified professional or your own independent financial professional for personalized advice or investment recommendations tailored to your specific goals, individual situation, and risk tolerance. All examples are hypothetical and are for illustrative purposes only.
Information contained in the materials included is believed to be from reliable sources, but no representations or guarantees are made as to the accuracy or completeness of information. This document is provided for information purposes only and should not be considered as investment advice.
Dunham & Associates Investment Counsel, Inc. is a Registered Investment Adviser and Broker/Dealer. Member FINRA/SIPC. Advisory services and securities offered through Dunham & Associates Investment Counsel, Inc.