Content Editor, Dunham | 2025 ThinkAdvisor Luminary Award Winner | 2026 Wealthies Finalist — Thought Leader of the Year | Macroeconomics, markets, geopolitics & global trends
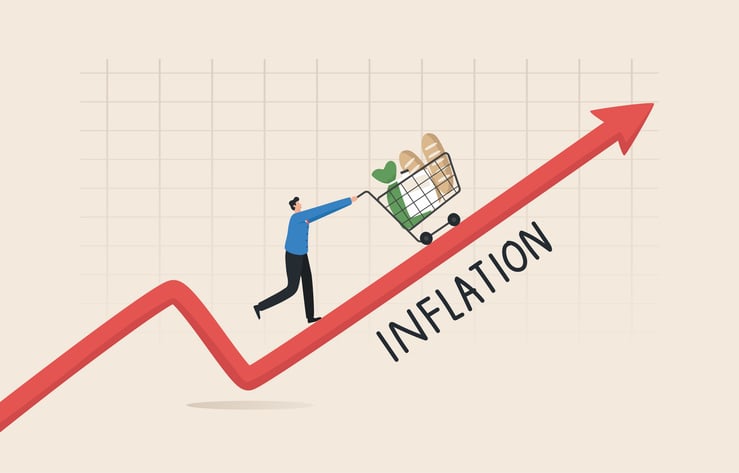
U.S. inflation has cut the dollar’s purchasing power by about 23% since January 2020, based on CPI-U data through August 2026. Slower inflation won’t reverse those earlier price increases. War-driven energy costs, the AI spending boom, and large federal deficits could keep pressure on prices, leaving households paying more while their budgets struggle to keep up.
What You Need to Know
Your dollar buys about 23% less than it did before COVID. Even if inflation slows, the price increases households have already absorbed don’t disappear.
Lower-income households have less room to breathe. Food, fuel, and rent eat up more of their budgets, and they own fewer assets that could help them keep up.
Three forces could make the squeeze worse: war-driven energy costs, the AI spending boom, and large federal deficits. All three could keep pressure on prices.
When paychecks stop stretching far enough, frustration doesn’t stay at the dinner table. It can reach the voting booth, push Washington to act, and leave markets guessing what comes next.
Listen to this blog here
11:27
I still remember what $20 bought six years ago - before the world flipped upside down.
In January 2020, that $20 bill bought a decent cart of groceries, most of a tank of gas (at least in Phoenix), and a casual dinner for one.
Today? I'm lucky if I get half of that.
Now, multiply that by the tens of millions of households across the country, and you start to see how brutal this inflationary wave has been on the structure of the economy.
But there's something even worse I don't see many mainstream economists mention.
And that’s the annual rate everyone quotes only measures the pace of inflation. It says nothing about how much has already piled into prices.
For instance, a 3% inflation print from here compounds on top of a price level that's already roughly 30% higher than it was in 2020 - making each year worse and worse for households that can't keep up.
And the truth is, the Fed can only slow the pace of inflation. It can't undo what's already happened.
So unfortunately, the worst of this may still be ahead.
Why Inflation Hits Lower-Income Households Harder
While everyone is feeling their purchasing power decline, not everyone is experiencing it the same way (that data point never shows up in the top-line CPI number).
Lower-income households spend a much bigger share of their budget on necessities - like food, fuel, rent – relative to wealthier households.
The New York Fed's recent Economic Heterogeneity Indicators3 put national inflation 0.6% higher for low-income households than for high-income households as of August 2026 - driven largely by low-income households' heavier gasoline spending share (wealthier households own disproportionately more things like EVs and solar panels to offset higher crude).
That’s a significant gap that’s amplifying wealth inequality and risks destabilizing the economy long-term.
But if we look at who owns the assets that even kept pace with inflation – it looks even worse.
According to the Fed’s Distributional Financial Accounts4, the top 10% of households by wealth held nearly 65% of household assets in the second quarter of 2026 – while the bottom half held just 5%.
Even more damning is that 88.1% of corporate equities and mutual fund shares belonged to the top 10%, vs. 0.6% for the bottom 50%.
Thus, as stock prices soared over the last few years via an AI boom - those gains largely went to households that already hold the most wealth.
The point is, millions of households have seen inflation eat away at their incomes nor did they have the assets to hedge it.
Now, they have to pay much higher prices just to buy the same equities with less income.
No wonder affordability is becoming such a political touchpoint.
And it’s only going to become more so.
Three Forces That Could Keep Inflation High
There's a term meteorologists use for what happens when hurricanes get close enough to each other - the Fujiwhara effect5.
Most of the time, storms spin along on their own, never close enough to interact – or the larger one absorbs the smaller one.
But sometimes - when two get near each other, travel at the same speed, and rotate in the same direction - something stranger happens. . .
They start orbiting a shared center – feeding off each other's momentum- and merging into something bigger and harder to predict than either storm alone.
Inflation right now looks a lot like that.
War-driven energy costs, AI-related spending, and a widening deficit are feeding off each other, at the same time, in the same direction.
And that’s a big problem.
War and Diesel Are the One Storm
Start with energy - because it touches everything else that moves through a truck.
Brent crude jumped more than 5% in a single session this week, touching $105.58 a barrel, as renewed Iran-UAE tensions put the Strait of Hormuz back in question.
U.S. average diesel – which is the fuel for the producer economy - already sat at an all-time high of $6.29 a gallon in September 2026, up 67.8% from a year earlier, per the Bureau of Transportation Statistics.
This gives you a sense of the AI buildout underway.
The dot-com years feel like the closest comparison. Investors knew they were watching a change in how the world worked, without necessarily knowing how it would unfold.
Today, companies are committing ungodly sums to AI before anyone knows how much of that spending will pay off.
But those projects need power now.
Data centers add huge amounts of electricity demand to grids that can’t expand overnight. Meeting that demand can require more expensive power generation and costly grid upgrades, putting pressure on the rates households pay.
Estimates of the inflation impact vary – but UBS9 recently estimated AI was pushing the core PCE price index about 0.4% higher. Meanwhile, Dallas Fed10 researchers modeled that in one scenario, they projected an addition of 0.05% to headline PCE inflation in 2026 - rising almost three-fold to 0.13 points by 2030.
Sure, those are different estimates. But both point in the same direction – higher inflation.
But electricity is only part of the bill.
There’s only so much copper, electrical equipment, and construction labor available at any given time – meaning data centers compete for resources that also go into homes, offices, cars, and other products.
Tech companies have deep pockets. When they bid more to build their projects, other buyers face pressure to pay more too.
For example, looking at memory chips (RAM) makes it painfully clear.
AI demand is drawing manufacturing capacity toward server memory, squeezing the supply available for consumer devices. In February, TrendForce11 forecast that conventional DRAM contract prices would jump 90%–95% in the first quarter of 2026 compared with the previous quarter - with PC memory prices expected to more than double.
That means higher prices for the average family trying to buy a new Microsoft Surface tablet or a MacBook laptop.
The point is, we all pay for it one way or another -whether we’re using AI or not.
How Federal Deficits and Money Growth Could Add to Inflation
Next to both of those is a government and Fed easing storm.
War spending, interest costs, and bloated spending meant more dollars are being sent by the government than what’s taken out via taxes (hence the deficit).
Said another way, that’s roughly $2T more spending in an economy already straining against energy and supply constraints.
Making matter worse, the money supply is growing too.
M2 - a measure of liquid cash/deposits in the system - reached $23.34 trillion13 in August.
That’s about $1 trillion more sloshing around than the end of December 2025 – a 4.4% increase.
Some of that money will stay in savings (more money available doesn’t mean more money immediately spent). But when the money supply grows faster than the economy’s ability to supply goods and services - prices can start simmering.
What Persistent Inflation Could Mean for Households and Markets
As if the 23% decline in purchasing power since 2020 wasn't bad enough — none of the three forces behind this show signs of slowing.
Gulf tensions remain ongoing (and may for years), AI capex keeps climbing (for now at least), and Washington isn't close to balancing a budget (probably won't ever happen).
Like a hurricane passing through, once you're in the eye of the storm, things can still get worse as it passes over.
When paychecks stop stretching far enough, people don't grumble over dinner and move on.
They start to vote differently. They protest. They demand someone fix it.
Thus, affordability is becoming one of the most defining political fights in the next cycle, and it's going to pull policy further toward whichever extreme promises to fix it fastest.
And that instability bleeds straight into markets.
A government under pressure to fix prices tends to lurch between tightening and stimulus, tariffs and subsidies, hikes and cuts. And markets hate nothing more than policy that won't sit still.
Inflation may keep cooling from here – but the price level won't fall back to where it started.
It never has.
The households that own assets have spent six years adjusting. The households that don't are still absorbing it.
That gap is only going to get wider, in the voting booth and in the markets both.
But as always, time will tell.
Frequently Asked Questions About Inflation and Purchasing Power
How much purchasing power has the dollar lost since 2020? The dollar lost about 23% of its purchasing power between January 2020 and August 2026, based on unadjusted CPI-U data. Prices rose roughly 30% over that period. You’d need about $130 to buy the same basket of goods and services that cost $100 in January 2020. Your household’s experience depends on what you buy.
Why are prices still high if inflation is going down? Lower inflation means prices are rising more slowly, not returning to where they started. If inflation falls from 5% to 3%, prices still rise another 3% on top of earlier increases. Individual products can get cheaper, but a broad decline in the overall price level requires deflation. Slower inflation alone won’t restore earlier prices.
Are AI data centers making my electricity bill more expensive? AI data centers can contribute to higher electricity bills by increasing power demand and requiring new generation and grid upgrades. The effect depends on your utility, available power supply, and how expansion costs are divided between data centers and other customers. Fuel prices and aging infrastructure also affect bills, so AI doesn’t explain every increase.
Why do higher diesel prices make groceries more expensive? Higher diesel prices raise the cost of moving food from farms and factories to stores. Diesel also fuels farm machinery and other equipment used in food production. Businesses may pass some of those costs to shoppers over time. The effect depends on how long fuel prices stay high and how much of the added cost businesses absorb.
Sources
U.S. Bureau of Labor Statistics — Consumer Price Index Historical Table for All Urban Consumers[bls.gov]
Federal Reserve Bank of Minneapolis — Inflation Calculator: Consumer Price Index, 1913–[minneapolisfed.org]
Federal Reserve Bank of New York — Economic Heterogeneity Indicators: National Inflation Report[newyorkfed.org]
Federal Reserve Bank of Dallas — Data Centers and Inflation[dallasfed.org]
TrendForce — Conventional DRAM Contract Prices Forecast to Rise 90%–95% in 1Q26
Disclosures
This communication is general in nature and provided for educational and informational purposes only. It should not be considered or relied upon as legal, tax or investment advice or an investment recommendation, or as a substitute for legal or tax counsel. Any investment products or services named herein are for illustrative purposes only and should not be considered an offer to buy or sell, or an investment recommendation for, any specific security, strategy or investment product or service. Always consult a qualified professional or your own independent financial professional for personalized advice or investment recommendations tailored to your specific goals, individual situation, and risk tolerance. All examples are hypothetical and are for illustrative purposes only.
Information contained in the materials included is believed to be from reliable sources, but no representations or guarantees are made as to the accuracy or completeness of information. This document is provided for information purposes only and should not be considered as investment advice.
Dunham & Associates Investment Counsel, Inc. is a Registered Investment Adviser and Broker/Dealer. Member FINRA/SIPC. Advisory services and securities offered through Dunham & Associates Investment Counsel, Inc.