Content Editor, Dunham | 2025 ThinkAdvisor Luminaries Award Winner | 2026 Wealthies Finalist, Thought Leader of the Year | Macroeconomics, markets, geopolitics & global trends
Updated July 2026:The capital cycle explains why supply, not demand, drives long-term investment returns: when capital floods an industry, competition erodes future profits, and when capital dries up, scarcity sets the stage for the next boom. Right now, that framework points to three signals worth watching — an AI investment frenzy, a commodities supply glut, and a gold market where new discoveries are drying up even as demand stays elevated.
Key Takeaways:
The capital cycle explains how capital inflows and outflows drive industry booms and busts.
When capital floods into an industry, returns usually fall. When capital dries up, returns often rise.
Most investors focus on demand, but supply trends are the real long-term driver of profits and valuations.
Overinvestment and heavy CapEx often precede poor future returns — a pattern known as the Asset Growth Anomaly.
Today's capital cycle signals suggest AI may be in a boom phase, commodities are stuck in a supply glut, and gold may be entering a new bull market.
The Mistake Most Investors Make
As they teach in Economics 101: when demand rises faster than supply, prices and profits surge. When supply floods the market, competition intensifies and returns fall. Simple enough.
Yet in practice, most investors obsess over demand forecasts - GDP growth, adoption curves, earnings growth - while overlooking the slower, quieter supply-side dynamics that ultimately shape long-term returns.
Demand is flashy. Supply is boring. And boring is often where the money is made.
That's where the capital cycle comes in.
What is the Capital Cycle?
The capital cycle is the pattern where returns on investment rise and fall based on how much capital flows into or out of an industry's supply side. High returns attract capital. That capital builds new supply. New supply erodes returns. Eventually the cycle reverses.
If you haven't read Capital Returns (2015) by Edward Chancellor, it's worth the time - the book is a deep dive into why industries follow this predictable boom-bust pattern. But the key mechanism comes down to a simple relationship: the balance between the return on capital and the cost of capital.
Return on Capital vs. Cost of Capital
Every business lives or dies by one rule. If return on capital (ROC) exceeds the cost of capital (COC), it creates value. If ROC falls below COC, it destroys value.
Think of it like renting a bike to deliver packages. If the rental costs $5 a day and you make $10 per day, you profit. If you only earn $3, you lose. Businesses run no differently.
So what happens when companies rake in high returns? They attract competition. Rivals expand, build factories, and add production lines. The industry floods with supply. Prices drop. Margins fade. And then the cycle reverses the other way.
The CapEx Trap: When Growth Destroys Returns
Chancellor’s research shows that returns on investment (ROIs) follow a predictable supply-driven cycle.
Further evidence comes from Eugene Fama - the economist behind the Efficient Market Hypothesis. He found a negative correlation (aka when one thing goes up, the other goes down) between a firm's capital expenditures (CapEx) and future investment returns.
Or put another way:
The more an industry expands – like buying assets, increasing capacity, taking on debt - the lower its future profits and returns will be.
And the more an industry contracts – like selling assets, shutting down capacity, deleveraging - the higher its future profits and returns will be.
“But doesn’t this seem counterintuitive? Shouldn’t growth increase future returns?”
It does, but up until a point. Eventually, the success of something may become its own demise.
Figure 1: Capital Returns, 2015
How Capital Cycles Actually Play Out
Think of it this way. . .
When an industry booms, capital floods in as investors and businesses chase profits. Analysts slap “BUY” ratings across the board, and market euphoria takes hold.
But this rush often leads to.
Overinvestment – companies grossly overpaying for assets.
Excess capacity – companies expanding too fast, flooding the market.
Eventually, the industry becomes oversaturated, supply outpaces demand and returns decline.
And as profits shrink, capital flees. Sentiment sours. Analysts flip to "SELL" ratings, and investors panic. Companies cut costs, consolidate, and sell assets.
But because of this, supply tightens again. And profit margins begin recovering (at least for those firms left standing).
Thus, this sets the stage for a new cycle of investment and expansion.
Why the Capital Cycle Matters for Long-Term Investors
Understanding the capital cycle gives investors a powerful advantage.
Instead of chasing hot industries where capital is flooding in (and future returns are likely to fall), investors should consider looking at shrinking sectors where capital is scarce and supply constraints can set the stage for future gains.
Because in the end, bull markets create bear markets. And bear markets create bull markets.
Let’s take a look at some history to see it in action. . .
Capital Cycle Case Studies: From Uranium to Freight Shipping
1. Uranium’s Boom, Bust, and Recovery — A Classic Capital Cycle
The capital cycle is a powerful tool for understanding commodity markets, and uranium is a textbook case.
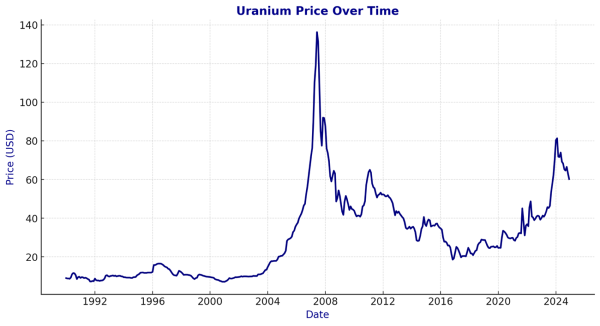
Boom (Early 2000s–2011): In the early 2000s, China, India, and other major economies ramped up nuclear power, sending uranium prices soaring. Thus, what was once an obscure commodity shot from $10 per pound in 2003 to $140 in 2007.
Miners rushed to expand and soak up those profits. Exploration surged. Hedge funds hoarded physical uranium, betting on even higher prices.
But, then came Fukushima. . .
Bust (2011–2020): The 2011 Fukushima Tsunami disaster crushed uranium sentiment. Japan - the world’s largest uranium importer - shut down its reactors. Germany vowed to exit nuclear entirely. Thus, demand collapsed.
But miners, having sunk billions into expansion already, kept producing to cover costs. Instead of cutting supply, they doubled down - pushing output higher to offset falling prices.
For instance, when uranium fell from $40 to $20 per pound, miners had to double production just to maintain revenue.
This continued until 2018, where uranium had crashed 70%, and most producers were bleeding cash.
Investors fled. Analysts abandoned the sector. Firms entered survival mode.
Boom Again (2017–Present): Finally, after years of pain, producers threw in the towel and began slashing output.
Kazakhstan, the world’s largest uranium supplier, cut production by 10% in 2017, another 20% in 2018, and made further reductions during COVID.
Thus, with supply tightening and nuclear demand rebounding, prices found a floor. Post-2020, uranium surged back.
Figure 2: St. Louis Federal Reserve, Dunham 2025
The cycle repeats. As prices rise, new investment and production will follow - setting up the next boom and bust.
2. Dry Bulk Shipping: The Boom-Bust Cycle
"O.K., I see how the supply side drives commodities. But what about other industries?"
Great question.
Dry bulk shipping is another perfect example of the capital cycle at work - rising and falling like clockwork.
Boom (Early 2000s–2008): After China started growing aggressively in the early-2000s, global demand for raw materials soared. Emerging markets boomed. Infrastructure projects drove commodity prices up – thus fueling shipping activity.
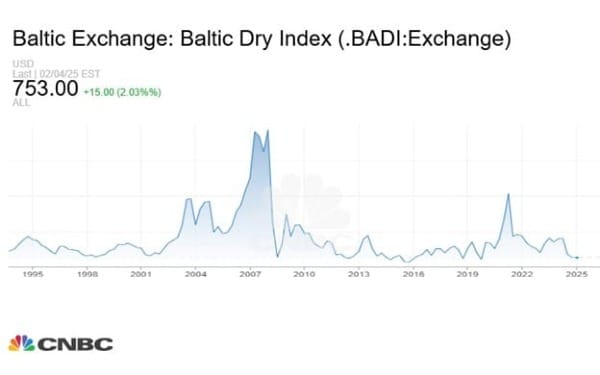
The Baltic Dry Index (BDI), which tracks shipping rates, hit an all-time high in 2008. Shipping firms were rushing to expand during this period, ordering new vessels deep into 2009.
Then - the 2008 financial crisis hit.
Figure 3: CNBC, February 2025
Bust (2008–2019) - Global trade plunged in 2008 – sending the BDI crashing 90% and leaving shipping firms with too many vessels and too little demand.
Finally, by 2016, the BDI bottomed out at 290 points - a record low. Overcapacity lingered. And the industry struggled for years.
Boom Again (2021): COVID-era stimulus and inflation sent freight rates surging in 2021. And, once again, shipping firms rushed to expand:
Fleet sizes grew.
Ship retirements (scrapping) hit a 16-year low in 2024.
More vessels kept hitting the water.
The Next Bust (2022-present?): Now, China and emerging markets are slowing. Supply is outpacing demand again. Freight rates are back below pre-pandemic levels.
Boom. Bust. Boom. Bust. The cycle repeats. Rising rates fuel overcapacity, which plants the seeds of the next downturn.
Another capital cycle at work.
Where Are We in the Capital Cycle Today?
I believe there are three major capital cycles playing out right now worth watching.
The explosive growth in AI stocks, driven by capital rushing in.
The bear market in commodities, as China slows and supply outpaces demand.
The potential bull market in gold amid tight supply, dearth of discoveries, and rising demand.
AI: Capital Flooding In
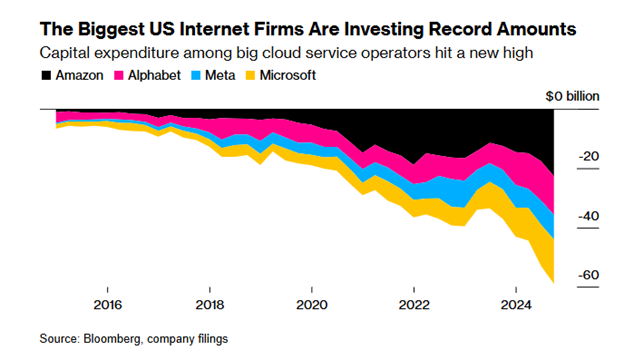
The AI revolution - fueled by companies like NVIDIA, Microsoft, and AMD - has triggered a massive capital influx. Billions are being poured into AI infrastructure, data centers, and chip manufacturing.
But as I detailed above, too much capital too quickly often sows the seeds of the next downturn:
Semiconductor spending is at record levels, with companies like TSMC and Intel ramping up production.
Data center construction is skyrocketing - with “hyperscalers” building at an unprecedented pace.
Now, while the AI rally is justified by real technological advancements, investors should watch for signs of overcapacity - when supply catches up and competition intensifies, margins could shrink, leading to an eventual bust.
Keep in mind we saw this happen recently with China’s DeepSeek rattling Silicon Valley and sending AI-related stocks plunging – I touched more on this not long ago (read here).
Commodities: Supply Glut Phase
On the other side of the capital cycle, commodities - especially industrial metals like steel, lithium, and oil - are struggling, largely due to China’s slowing economy.
China’s real estate crisis and weak manufacturing data have curbed demand for raw materials.
Steel, aluminum, and concrete producers expanded aggressively over the last decade - expecting continued high demand. But now, factories are running at overcapacity, while demand is fading, sending margins spiraling (just look at China’s iron and steel firms for example)3.
Despite lower prices, many producers are still pumping out supply to stay afloat, making the downturn even worse (similar to uranium in the 2010s).
This is the classic capital cycle at work. AI is in the investment frenzy stage, with capital flooding in. Commodities are in the supply-glut stage, as oversupply and weak demand weigh on prices.
Note that the exception here is copper - where a multi-year supply deficit is expected over the coming decade.
Of course, significant currency debasement and government stimulus could spur demand for commodities. But for now, watch the supply levels.
Gold’s Supply Crunch
So, while commodities like copper and steel are facing oversupply, gold is actually in the opposite position - supply is diminishing, yet demand is rising.
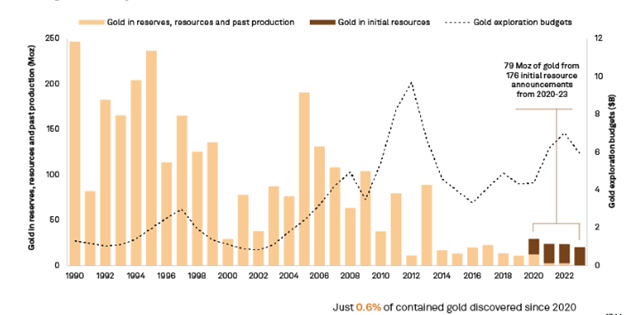
For starters, gold miners have struggled to find new projects for years. It’s simply getting much harder to find high-quality gold deposits (even though exploration budgets have risen steadily).
To put this into perspective, according to S&P Global4:
The 1990s saw 183 discoveries.
The 2000s saw 120 discoveries.
The 2010s saw 46 discoveries.
But so far in the 2020s, there’s only been 5 discoveries. . .
Figure 5: S&P Global, August 2024
Meanwhile, many of these gold mines are aging, leading to declining production.
This supply-demand dynamic mirrors past cycles where scarce supply + rising demand = a potential bull market ahead.
Keep in mind that historically speaking, when miners underinvest, gold prices rise until they’re forced to ramp up production again.
Thus, I personally believe gold will continue pushing higher.
What I’m Keeping My Eye On
AI Sector - Keep an eye on overinvestment, declining profit margins, and excessive capital expansion - these often signal the top of the cycle.
Commodities - Look for shutdowns, bankruptcies, and supply cuts as these often mark the bottom of the cycle and the start of the next bull market.
Gold - watch for supply constraints, rising central bank buying, and investor demand - these trends could continue pushinggold to new highs.
Final Thoughts
I’ve covered a lot in just 2,000 words. But of course, there’s much more to this.
Markets are driven by multiple forces – from monetary policy and investor psychology (fear and greed) to demographic trends and more. Thus, the capital cycle is just one piece of the larger puzzle.
However, I hope I’ve shown you how powerful this framework can be.
By understanding the capital cycle and combining it with other key indicators, you can spot opportunities before the crowd, avoid common pitfalls, and make smarter investment decisions.
Most investors focus on demand. Few watch supply.
Yet history shows:
When capital floods in, profits shrink.
When capital dries up, returns rise.
Oil in 2015. Housing in 2008. Tech in 2000. The pattern repeats across industries.
So, before chasing the next hot sector, ask yourself: Where are we in the capital cycle?
Because bull markets create bear markets. And bear markets create bull markets.
As always, this is just some food for thought.
FAQ
What is the capital cycle? The capital cycle describes how industry returns can change as investment expands or contracts. High profits and strong demand can attract new competitors and encourage existing firms to add capacity. If supply later grows faster than demand, prices and profit margins may weaken. When investment slows, capacity can become scarce again, which may improve returns for surviving companies. The cycle can vary widely by industry and is not a timing tool for investors.
What is the asset growth anomaly? The asset growth anomaly is a research finding that companies with high total asset growth have historically earned lower subsequent stock returns than companies with low asset growth. The finding is most closely associated with research by Michael Cooper, Huseyin Gulen, and Michael Schill, not Eugene Fama alone. Asset growth can result from acquisitions, capital expenditures, inventory growth, or other expansion. The relationship is historical and does not predict the return of any individual company.
Is gold’s supply actually shrinking? Not in terms of current mine output. World Gold Council estimates show global mine production reached a record 3,672 tonnes in 2025, up about 1% from the prior year. The longer-term concern is discovery quality and volume. Industry research has found that major new discoveries have become far less frequent since 2020 than in prior decades, which could limit future mine supply growth. Current production can remain strong even as the pipeline of major discoveries weakens.
Is AI in a capital-cycle boom phase? AI infrastructure investment shows features often associated with a capital-cycle expansion, including rising spending on chips, data centers, power capacity, and related equipment. Global AI-related investment is projected to exceed $1 trillion in 2026, while data-center electricity demand is expected to rise sharply through 2030. Whether this produces overcapacity depends on how quickly supply expands relative to customer demand, utilization, pricing, and revenue. A large investment cycle can support real technological progress while still creating valuation and margin risks for some companies.
This communication is general in nature and provided for educational and informational purposes only. It should not be considered or relied upon as legal, tax or investment advice or an investment recommendation, or as a substitute for legal or tax counsel. Any investment products or services named herein are for illustrative purposes only and should not be considered an offer to buy or sell, or an investment recommendation for, any specific security, strategy or investment product or service. Always consult a qualified professional or your own independent financial professional for personalized advice or investment recommendations tailored to your specific goals, individual situation, and risk tolerance. All examples are hypothetical and are for illustrative purposes only.
Information contained in the materials included is believed to be from reliable sources, but no representations or guarantees are made as to the accuracy or completeness of information. This document is provided for information purposes only and should not be considered as investment advice.
Dunham & Associates Investment Counsel, Inc. is a Registered Investment Adviser and Broker/Dealer. Member FINRA/SIPC. Advisory services and securities offered through Dunham & Associates Investment Counsel, Inc.


.jpg&w=3840&q=75)