Content Editor, Dunham | 2025 ThinkAdvisor Luminaries Award Winner | 2026 Wealthies Finalist, Thought Leader of the Year | Macroeconomics, markets, geopolitics & global trends
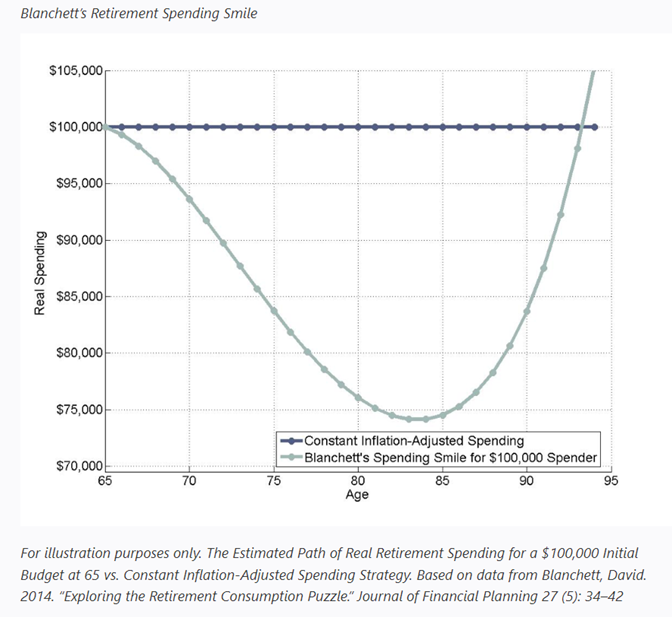
The retirement spending smile is a U‑shaped curve in retiree spending. Spending starts high in early retirement, declines through the mid‑70s and early 80s as discretionary activity slows, then rises again as healthcare and long‑term care costs increase. Real spending typically drops 25–30% before that late‑stage rebound.
Key Takeaways
Spending changes with age. Retirees typically spend more early in retirement on leisure, then less as they age, until healthcare costs rise again later.
It’s a “U-shaped” curve. Real spending declines by roughly 25–30% through age 84 before rising with medical and care costs.
Advisors should plan dynamically. Static inflation-based projections can overestimate long-term spending needs.
Personalization matters. Aligning withdrawal rates and portfolios to each retiree’s spending phase enhances sustainability and confidence.
Macro impact. As baby boomers retire and spend less, this pattern could slow consumption and economic growth.
As a financial advisor, it's crucial to help retirees plan for these changes to sustain their lifestyle. And understanding realistic retirement spending patterns is key.
And in the realm of retirement planning, one prevailing assumption seems to have become the standard – that as retirees progress through their golden years, their spending naturally increases in tandem with inflation.
This makes sense, in theory.
But if we delve deeper into the realities of retirement and spending patterns, you'll find that this assumption doesn't always hold true.
This is known as the ‘retirement spending smile’ effect – a fascinating phenomenon that sheds light on the changing nature of retiree spending habits.
What Is the Retirement Spending Smile?
Picture this: retirees kick off their post-career journey with a burst of activity, embracing newfound freedom with lavish travels and leisure pursuits. But as the years roll by, priorities shift. Discretionary spending wanes, while healthcare costs take center stage. It's a journey marked by peaks and valleys, akin to a smile on a graph (a “U” shape).
Why? Because contrary to many economic and financial planning assumptions, the ‘retirement spending smile’ effect holds significant implications for estimating withdrawal rates, sequence risk, and optimizing spending throughout retirement.
And while there are many meaningful retirement strategies, it’s worth looking into this one.
So, let's discuss the 'retirement spending smile' and the insights we can learn from it. . .
How Does the Retirement Spending Smile Work?
In the ongoing discussion about retirement spending, David Blanchett's article "Exploring the Retirement Consumption Puzzle" - published in the May 2014 issue of the Journal of Financial Planning1 - added a fresh perspective to the debate.
And while a bit dated, it’s still worth going over.
Simply put, Blanchett took a deep dive into the paradoxical phenomenon of retiree spending patterns. Noting that, contrary to many conventional assumptions of increased spending, spending actually decreases as retirees go through their retirement years.
Blanchett's study is noteworthy for its long-view approach from tracking the spending habits of the same households over time throughout their retirement journey.
Thus, by analyzing ‘real’ household survey data – meaning inflation-adjusted - from 2001 to 2009, Blanchett provides insights that address issues encountered when comparing the spending of different age groups at the same point in time.
Blanchett identified a fascinating trend he dubs the "retirement spending smile," which varies slightly depending on the initial household spending levels.
For example, Blanchett illustrates this concept with an exhibit showcasing the spending trajectory of a retiree starting with $100,000 in expenditures at retirement.
On average, this household's spending journey during retirement paints an intriguing picture.
There was a gradual decline in real spending until they reached a low point at age eighty-four, bottoming out at $74,146 – thus marking a significant drop of nearly 26% in real spending over time.
Thus, his analysis revealed that retirees tended to spend more on travel, dining out, and other discretionary indulgences during the initial stages of retirement. However, as retirees got older, there was a notable decline in discretionary expenses alongside a rise in healthcare costs.
More notable was that this rise in healthcare expenditures typically outweighed the reduction in other spending categories.
What Are the Four Stages of the Retirement Spending Smile?
So, put simply, the four stages of the retirement spending smile are:
1. The Transition Stage Work winds down. Income steps back. Spending is in flux as retirees adjust to a new rhythm — some still earning, most starting to draw down. This is the adjustment period before full retirement spending kicks in.
2. The Leisure Stage This is the high-spend phase. Travel. Dining. Hobbies. Bucket-list experiences. Retirees are healthy, active, and spending on the life they planned for. This is where the smile starts on the left side of the curve.
3. The Health Decline Stage Energy slows. Discretionary spending drops. Healthcare costs begin to climb. Retirees scale back trips and activities but spend more on medications, doctors, and home modifications. The curve dips to its lowest point around age 84.
4. The End-of-Life Care Stage Long-term care and medical costs spike. This is the right side of the smile — and the most financially unpredictable phase. Proper planning here is the difference between a sustainable portfolio and one that runs dry at the worst possible time.
Why Does the Retirement Spending Smile Matter for Advisors?
There are a couple of major implications of the retirement spending smile.
1. Realistic Retirement Spending Estimates: Many retirees and advisors use a static inflation-adjusted spending rate to project expenses. This approach can lead to over-saving or unnecessary financial anxiety. By accounting for the retirement spending smile, advisors can create tailored strategies that reflect a retiree’s changing needs and priorities over time.
2. Impact on the Economy: the spending smile also has macroeconomic implications because of diminishing spending during retirement.
As I’ve argued before in ‘The Perfect Storm: Why This May Be The Most Important Time For A Financial Advisor’, there’s a tidal wave of individuals hitting retirement age in the U.S. – roughly 12,000 per day until 2030. By then, roughly 20% of the entire U.S. will be retirement age. Meanwhile, the U.S. fertility rate continues sinking lower and lower.
If this wall of retirees spends less – as the Blanchett study showed – and there are not enough younger individuals to make up for their lost spending, it could be a significant drag on economic and productivity growth.
How Should Advisors Use the Retirement Spending Smile in Planning?
The retirement spending smile is more than interesting research. It's a practical planning tool.
Static, inflation‑adjusted withdrawal projections tend to overestimate spending in mid‑retirement and underestimate healthcare costs at the end. And that mismatch creates unnecessary anxiety for clients and often pushes portfolios into being more conservative than they need to be.
Now, the better path is a dynamic model – one that front‑loads discretionary spending early, pulls back projections in the middle years, and builds a clear healthcare reserve for the later stage.
Advisors who build that model earn something more valuable than a one‑time plan. They earn the confidence that comes from a client who says, “You actually understand how I’m going to live.”
That is what separates a retirement plan from a retirement strategy.
FAQ
What is the retirement spending smile? The retirement spending smile describes an average pattern in which inflation-adjusted household spending starts relatively high in early retirement, declines through the middle years, and may rise later as healthcare and long-term care costs increase. When average spending is charted over time, the pattern can resemble a U-shaped curve, or a smile. Recent research also finds that median retiree spending may continue to decline in later life, creating more of a “smirk” than a smile.
How much does spending typically decline during retirement? Spending often declines in real, inflation-adjusted terms through much of retirement, but the amount varies widely. In David Blanchett’s earlier research, a household beginning retirement with $100,000 in annual spending was projected to see average real spending decline to about $74,146 by age 84, or nearly 26%. That example is a research-based illustration, not a universal spending benchmark for every retiree.
Does the retirement spending smile apply to every retiree? No. The retirement spending smile is an average pattern, and individual results can vary substantially based on health, income, housing, family circumstances, lifestyle, and longevity. Some retirees may see spending decline steadily over time. Others may face large late-life healthcare or long-term care expenses that increase spending. Recent research suggests that these individual healthcare shocks may help explain why average spending can rise later in life even when median spending continues to fall.
How should financial advisors use the retirement spending smile in retirement planning? Financial advisors can use the spending smile as one input when testing whether a client’s retirement plan reflects changing needs over time. Rather than assuming every expense increases with inflation each year, advisors can separate essential expenses, discretionary early-retirement spending, and potential late-life healthcare costs. This can support a more flexible withdrawal approach, but a plan should still account for uncertain healthcare expenses, longevity, market returns, inflation, taxes, and personal goals.
This communication is general in nature and provided for educational and informational purposes only. It should not be considered or relied upon as legal, tax, or investment advice or an investment recommendation, or as a substitute for legal counsel. Any investment products or services named herein are for illustrative purposes only and should not be considered an offer to buy or sell, or an investment recommendation for, any specific security, strategy, or investment product or service. Always consult a qualified professional or your own independent financial professional for personalized advice or investment recommendations tailored to your specific goals, individual situation, and risk tolerance.
Information contained in the materials included is believed to be from reliable sources, but no representations or guarantees are made as to the accuracy or completeness of information. This document is provided for information purposes only and should not be considered as investment advice
Dunham & Associates Investment Counsel, Inc. is a Registered Investment Adviser and Broker/Dealer. Member FINRA / SIPC. Advisory services and securities offered through Dunham & Associates Investment Counsel, Inc.
What Is the Retirement Spending Smile? How It Impacts Retirement Planning | Dunham